Authors: Evan L. Sneed, Edward W. Schwieterman, Sarah R. Peacock, Nicholas F. Wogan and Timothy W. Lyons
First Author’s Institution: Department of Earth and Planetary Sciences, University of California, Riverside CA, USA
Status: submitted to AAS Journals [open access]
Planets have been found around stars of all shapes and sizes, from hot and bright O and B stars to small, dim M dwarf stars. But just because planets are found around these stars doesn’t mean conditions are suitable for life. A host star’s properties have a fundamental impact on the ability of a planet to host life. O and B stars are so hot and bright that they only last a few million years, not quite long enough for life to evolve (life on Earth took at least a couple hundred million years to start). In contrast, M dwarf stars are so dim that their habitable zones, defined as the distance from the star in which the temperature is just right for liquid water to exist on a planet’s surface, are very close to the star. At first glance, being closer to the star might seem beneficial for habitability? Unfortunately, unlike stars like our Sun, M dwarf stars have much more active lifestyles, with frequent powerful flares and prolonged X-ray and UV emission. These processes are the perfect trigger to strip away planetary atmospheres and sterilize surfaces, possibly preventing life from ever evolving in the first place.
M dwarf stars are still of great interest in the search for life though because they are the most common type of star in the Galaxy. In particular, the planetary system TRAPPIST-1 has been instrumental in the search for life in these stellar environments. TRAPPIST-1 is a nearby M dwarf star hosting an astonishing seven (possibly rocky) planets, three of which are in the habitable zone. But could the flares and high-energy emission from TRAPPIST-1 prevent life from evolving on these planets at all? The authors of today’s paper set out to understand how the uncertainties in these stellar properties could affect these planets’ abilities to host life.
Know Thy Star
The authors use TRAPPIST-1e as a case study to explore the impact of TRAPPIST-1’s high- energy radiation on its atmosphere. In particular, instead of simulating an Earth-like atmosphere around TRAPPIST-1e, the authors choose to simulate an Archean Earth atmosphere. The Archean Eon occurred from ~ 4.5 to 2 billion years ago and is widely thought to represent the time period on Earth when microbial life first evolved. Earth’s atmosphere during this time had a much higher concentration of carbon dioxide with little oxygen. Methane would have been much more abundant as a product from microbial life. Nitrogen, on the other hand, would have been the same, if not less, than the amounts we see in Earth’s atmosphere today. (For reference: our atmosphere today is made up of 78% nitrogen and about 20% of oxygen with trace amounts of carbon dioxide.) The authors chose to simulate this type of atmosphere for a few reasons: 1) the Archean Earth represents a transition in Earth’s history from a lifeless world to life playing a major role in our atmospheric composition and 2) it provides an example of a habitable environment that differs substantially from modern life here on Earth.
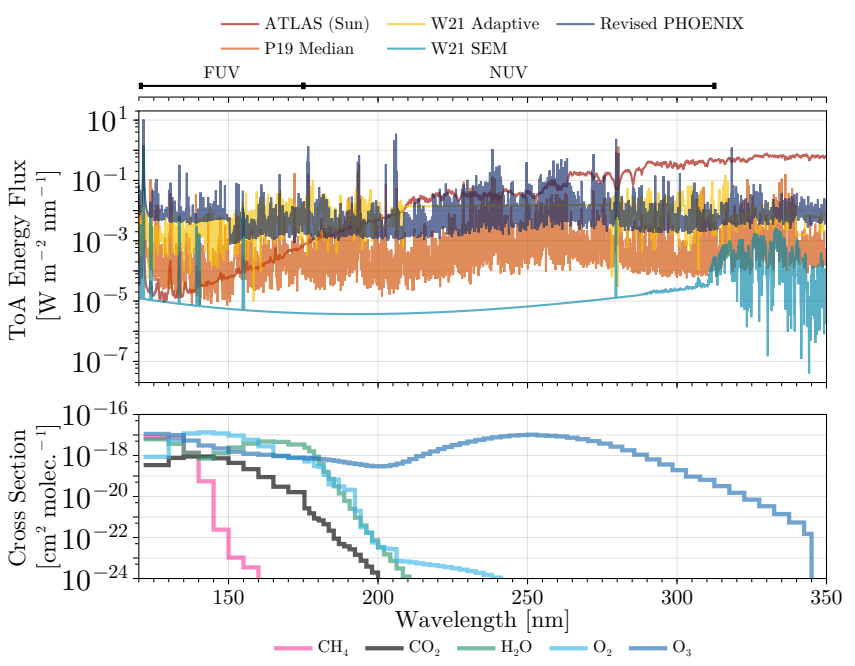
The authors use five different models of TRAPPIST-1’s X-ray and UV emission as inputs to atmospheric models of an Archean-like TRAPPIST-1e. This is to understand how different stellar models can affect the overall atmospheric photochemistry (chemistry in the atmosphere caused by the absorption of starlight). Figure 1 shows the differences between the stellar models and where in that same wavelength range that molecules in the planet’s atmosphere would absorb the light.
Know Thy Life
After computing the stellar flux and the associated uncertainties of each model, the authors construct 1-D atmospheric models using the mass and radius of TRAPPIST-1e and the composition of Archean Earth. The models are broken down into two main classes: biotic and abiotic. To distinguish between a planet that has life and one that does not, the authors use a parameter called the dry deposition velocity. This velocity determines how much of the atmospheric gases are removed at the planet’s surface before the remaining gas returns back to the atmosphere. Microbial life on the surface will consume more carbon dioxide, hydrogen and oxygen in the atmosphere than a planet with no life on the surface. Thus, the dry deposition velocity will increase in the biotic case as there is a stronger exchange of molecules between the surface and the atmosphere than the abiotic case.
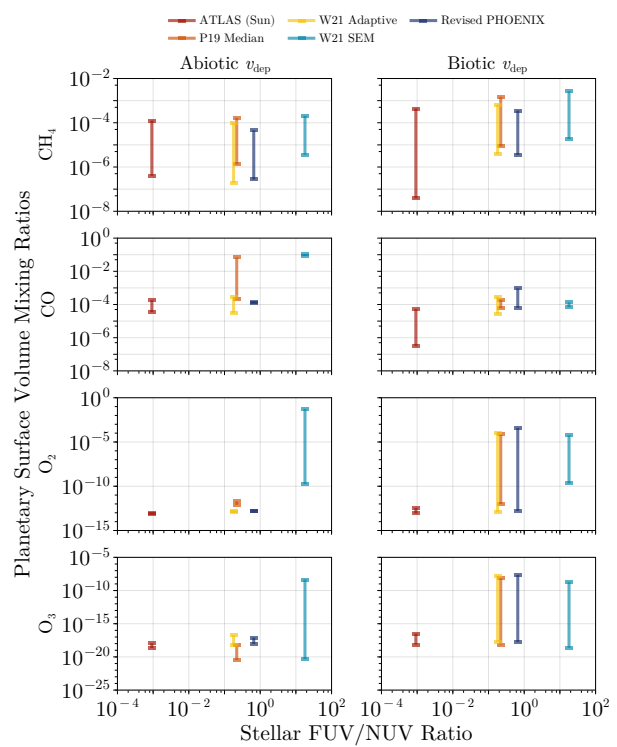
After generating these atmospheric models, they use the resulting concentrations of molecules to simulate transmission spectra of the planet to understand how astronomers would see these differences observationally. The resulting concentrations are shown in Figure 2 for both the biotic atmosphere and the abiotic atmosphere. The presence of methane (CH4) and ozone (O3) together is thought to be an atmospheric biosignature as typically these molecules destroy each other in reactions. A high concentration of both suggests life on the surface is actively replenishing both molecules. The authors found that some stellar models (light blue) allow for atmospheric methane and ozone to coexist in high concentrations even in abiotic environments. This is due to carbon dioxide photochemistry producing large quantities of ozone and geological activity replenishing methane. CO, however, remains a powerful “anti-biosignature” that can be used to distinguish between these two cases. In the models where methane and ozone persist in both the biotic and abiotic cases (light blue), CO concentration remains high in the abiotic case while lower in the biotic case. This is indicative of CO consumption by microbial life and could be a useful tool where stellar flux models break down. In the search for life, knowing thy star is the first step in knowing thy life!
Astrobite edited by Niloofar Sharei
Featured image credit: NASA