
Title: X-Shooter survey of disk accretion in Upper Scorpius⋆ II. A lack of correlation between accretion rates and disk properties
Authors: A. Empey, C.F. Manara, R. Garcia Lopez, A. Natta, R. Claes, F. Zagaria, J.M. Alcalá, R. Anania, G. Beccari, J. Carpenter, S. Facchini, D. Fedele, G. Lodato, K. Mauco, A. Miotello, B. Nisini, I. Pascucci, L. Piscarreta, G. Rosotti, A. Scholz, L. Testi, M. Vioque
First Author’s Institution: University College Dublin, Ireland
Status: Accepted for publication in Astronomy and Astrophysics (A&A) [open access]
The systems in which planets are born
Young stars at the centre of protoplanetary discs have a profound impact on the dusty, gassy discs around them in which planets are formed. To learn how planets are created, grow and move in these systems, we need to understand how the systems themselves evolve.
If you want to better understand how a person grows, you could do a study where you measure their height, their weight and whatever else you are interested in regularly over the course of a few years. However, when it comes to star systems with protoplanetary discs there is a problem. These systems take millions of years to develop, so we can’t just watch and wait. Instead, astronomers look at groups of these systems of different ages in different star forming regions to see how these systems might change over time. Previous research has focused on protoplanetary discs in the 1 to 3 million years age group but more study is needed for slightly older systems.
The Upper Scorpius Region
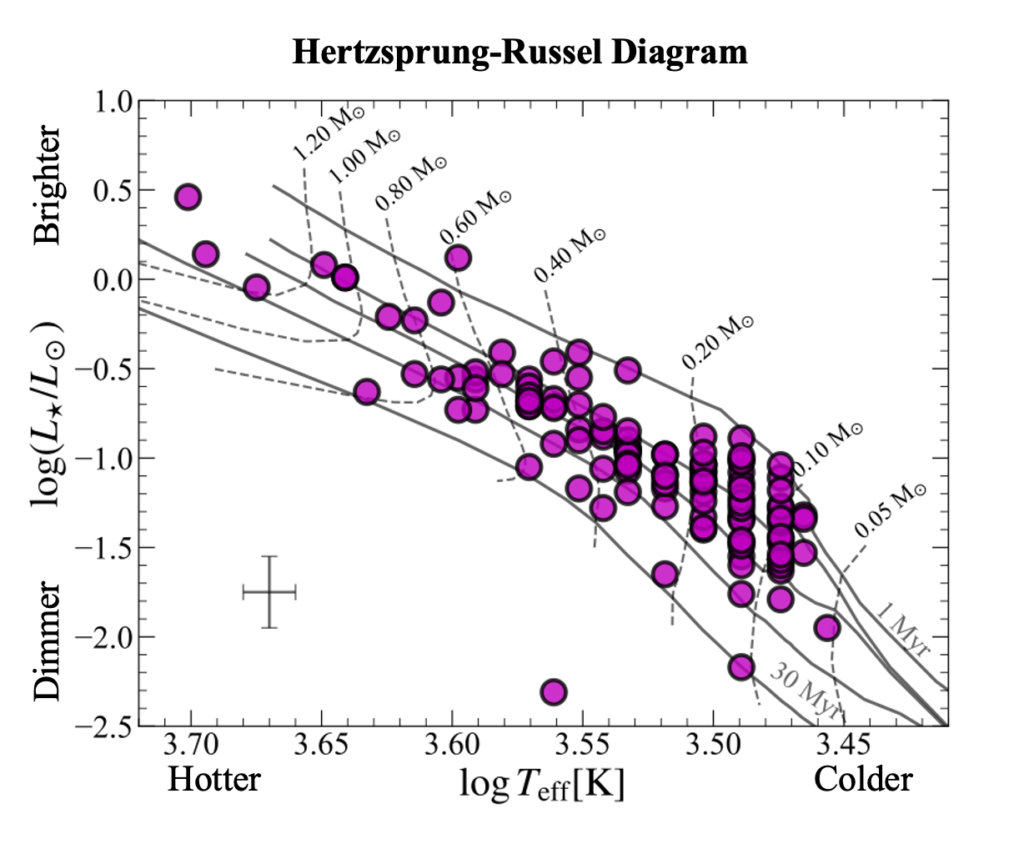
Today’s paper addresses that gap in the research by looking at 127 stars with protoplanetary discs in the Upper Scorpius region. Figure 1 shows a Hertzsprung-Russel diagram in which you can see that the majority of these stars are between 3 and 10 million years old. Using data from the X-Shooter instrument mounted on the European Southern Observatory’s Very Large Telescope in Chile, the researchers extracted as much information as they could about the stars and the discs around them. They looked at properties such as how bright the stars are, their age, and the size and mass of their discs. In particular, they were interested in the rate of accretion (how fast the star eats the material in the disc).
Stellar Appetites
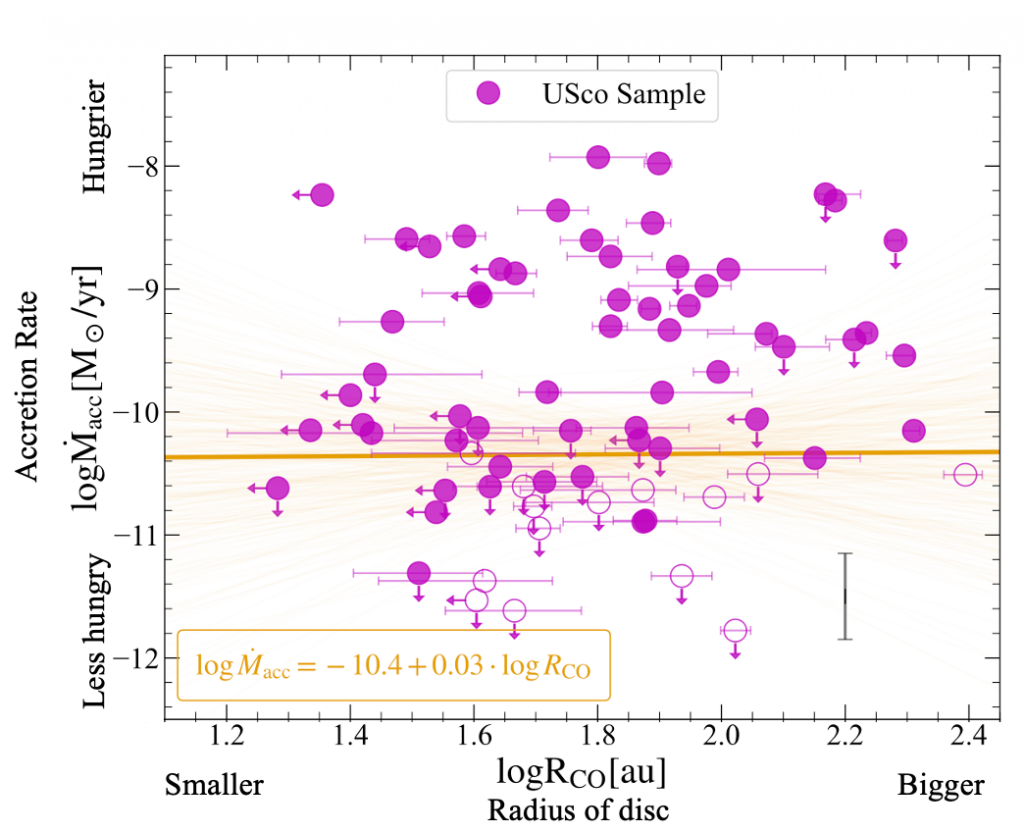
Rather than just looking at each of these properties in isolation, the authors were interested in how these properties relate to each other. One of their most interesting results is shown in Figure 2. The rate of accretion of material from the disc onto the star is plotted against the radius of the gas disc (defined as the radius which contains 90% of the disc’s total brightness). This plot shows that the size of the gas disc has no effect on the rate at which the star eats the material in the disc. This suggests that the inner and outer parts of the disc are no longer acting together, or are what scientists call “decoupled”. Furthermore, there is a huge spread in values of accretion rate for any given disc size. This is unexpected, as current models of protoplanetary discs predict less spread in the data. This may cause scientists to rethink their understanding of disc evolution.
Since the size of the disc didn’t affect how hungry the star was, the authors next step was to try plotting the accretion rate against (a proxy for) the mass of the gas disc, as shown in Figure 3. Directly measuring the mass of the gas in the disc is very hard, so the authors use their observations of the dust to infer the gas mass. As well as their data shown in purple, the authors included results from previous studies of slightly younger systems in grey. Similarly to Figure 2, it can be seen that there is a large spread of how hungry a star is for any disc mass. However, the authors noted that the hungriest stars in the Upper Scorpius region are less hungry than the hungriest stars in younger systems. Additionally, the Upper Scorpius Region shows a wider spread of accretion rate values and a weaker correlation between the accretion rate and disc mass parameters than younger regions.
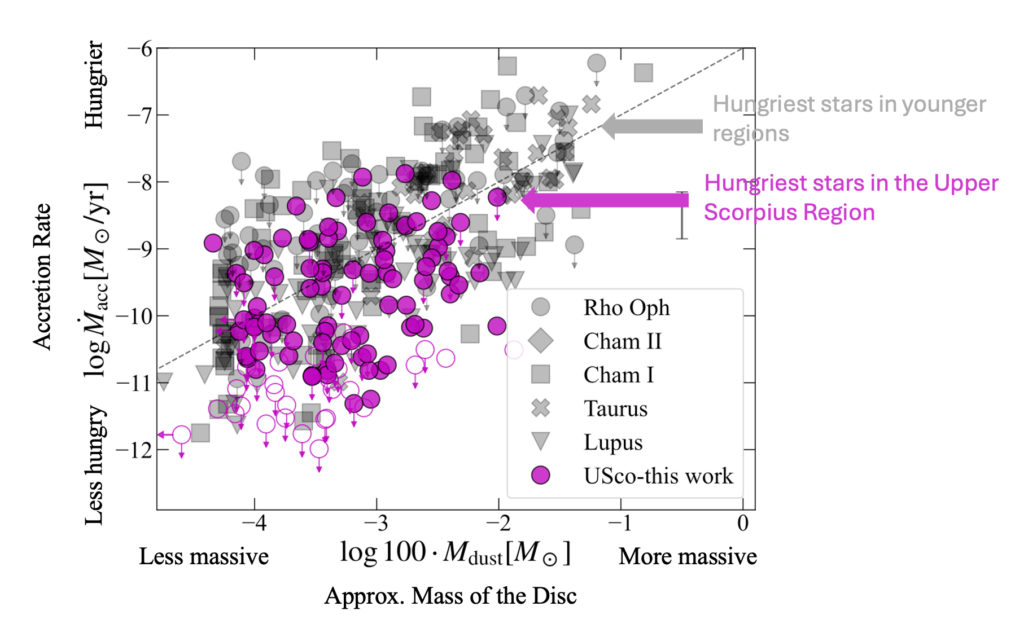
The authors concluded that these results collectively cannot be described by existing models of protoplanetary disc evolution which predict different slopes and spreads in the data. Instead, the results suggest that the rules about stellar eating habits assumed from studies of younger stars may have to be revisited to describe older ones.
Astrobite edited by: Joe Williams
Featured Image Credit: Adapted from ALMA (ESO/NAOJ/NRAO) licensed under CC BY 4.0.
Disclaimer: N. Bond is a member of the same department as some of the authors of this paper including the first author, but was not involved in the research carried out in the presented article.

