- Title: The First Two Years of Electromagnetic Follow-Up with Advanced LIGO and Virgo
- Authors: Leo P. Singer, Larry R. Price, Ben Farr, Alex L. Urban, Chris Pankow, Salvatore Vitale, John Veitch, Will M. Farr, Chad Hanna, Kipp Cannon, Tom Downes, Philip Graff, Carl-Johan Haster, Ilya Mandel, Trevor Sidery, Alberto Vecchio
- First author’s institution: LIGO Laboratory, Caltech
The “advanced generation” of LIGO’s two and Virgo’s one gravitational wave detectors come online in 2015 and 2016 respectively. If these instruments detect gravitational waves from mergers of neutron stars and/or black holes (let me just call these “compact mergers”), they are expected to alert cooperating electromagnetic telescopes with pointing information.
Why? Because overwhelming evidence indicates that compact mergers involving at least one neutron star are sometimes accompanied by minutes-long x-ray or optical afterglows, days-long optical or infrared kilonovae, and maybe even years-long radio emission (let me just call all of these “short bright flashes”). Detecting and studying short bright flashes requires LIGO/Virgo to give quick and precise pointing information.
But how quickly will these instruments be able to detect a gravitational wave, and how precisely will they be able to tell their partner telescopes where to point? Today’s authors answer these questions for the most promising and best-understood systems, binary neutron star mergers (let me just call these “BNS mergers”). Specifically, they take a realistic look at LIGO/Virgo’s first two years online, including their early sensitivity and expected downtime.
Keep in mind that these detectors will be slowly improving their sensitivity over the next decade. Furthermore, at design sensitivity, which LIGO/Virgo expect to achieve around 2019, the highly-uncertain BNS merger rate implies scenarios ranging from 0.4 to 400 detections per year.
How Quickly?
Fig. 1, taken from today’s paper, displays LIGO/Virgo’s state-of-the-art detection timeline up against the various timescales of light emission from a BNS merger.
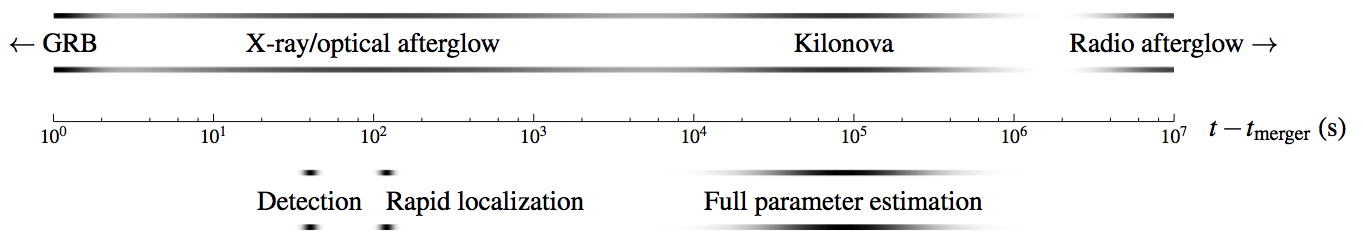
Figure 1: A rough timeline for possible electromagnetic counterparts to a BNS merger, and LIGO/Virgo’s current detection capabilities.
How Precisely?
But how precise will the rapid sky localization be? Today’s authors confirm what others have found, that most gravitational wave detections occuring in the next few years will provide pointing information no better than hundreds to a thousand square degrees, even after the days-latent parameter estimation has been computed. Hundreds of square degrees is a big patch of sky, around 1% of it! (The Moon spans about a fifth of a square degree.)
The histograms below show the fraction of all detections that LIGO/Virgo can localize to a given angular region with 90% confidence. The left panel represents 2015, the right panel 2016. Notice that in 2015, the rapid localization (red curve) is approximately as good as the days-later parameter estimation (blue curve). Note, the higher the curve, the more events are localized to small regions.
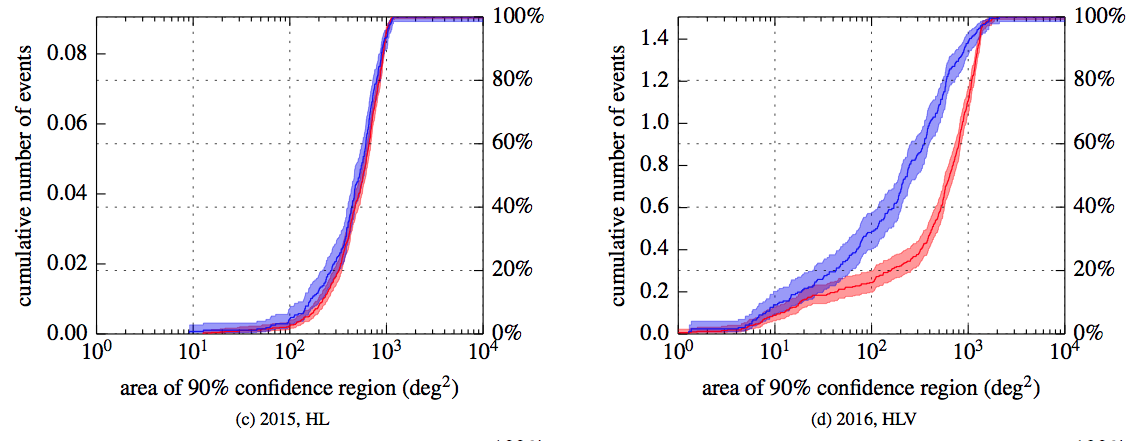
Figure 2: The fraction of all detections that LIGO/Virgo can localize to a given angular region with 90% confidence. (Note, the full sky spans ~40,000 deg2.) The bottom axis shows the size of the 90% confidence region, and the right axis shows the percentage of all detections that could be localized to that angular size or smaller. (The left axis translates this percentage to numbers of detections, using very uncertain estimates of BNS merger rates.) The left panel (c) represents 2015, when only LIGO’s two detectors are in use. The right panel (d) represents 2016 when Virgo joins them. The red curve represents the rapid localization that is finished in about a minute. The higher blue curve represents the more accurate parameter estimation that takes hours to days.
How’d they Figure that Out?
They came to this conclusion by simulating a suite of realistic detection scenarios. Using ~1000 imaginary detections from an astrophysically-motivated source population. That is, for each event, they pick a point in the 3-dimensional detectable volume, draw two neutron star masses from the observed neutron star mass distribution, and pick a randomly-oriented spin for each star and an orientation of the orbital plane. From these parameters they construct a theoretical waveform and bury it into simulated detector noise. Then they “search” the noise blindly with the state-of-the-art LIGO/Virgo detection algorithms. Then they apply LIGO/Virgo’s data analysis pipeline to draw sky maps, or probability distributions over the whole sky. Here’s a typical sky map:

Figure 3: An example of a sky map for a 2015 detector scenario. The map is fixed to the Earth just as the detectors are. The darkest red pixels represent the most likely directions to look for an electromagnetic signal. The star symbol indicates the actual direction of the simulated source. Notice that there are two distinct regions of high probability. This is a common feature of gravitational waves detected by two nearly-aligned interferometers. The long arcs represent the great circle of equal distance between the LIGO detectors in Washington and Louisiana.
The strange double swath of probability is actually quite common in this early detector era. This type of sky map arises because the two LIGO detectors (one in Washington, one in Louisiana) were built with nearly identical alignments. This means they cannot distinguish crucial polarization information which would clue them in to whether a source is nearly straight up or nearly straight down.
These authors have simulated a suite of detection scenarios to give their partner telescopes a realistic picture of the pointing information LIGO/Virgo will be able to provide if they makes any detections in 2015-2016. Many of the detections involve sources localized to long arcs of the sky occupying hundreds to a thousand deg2. And many of the sky localizations will come in the form of two or more equally-likely patches of sky, up to 180 deg apart. This is helpful (though perhaps disheartening) information for collaborators planning to point x-ray, optical, infrared, or radio telescopes at gravitational wave sources.
A final note about this paper. The authors have made their code and their extensive data available online. I appreciate the effort they have made to make the data very usable! Check it out.
Author
Trackbacks/Pingbacks