 The undergrad research series is where we feature the research that you’re doing. If you’ve missed the previous installments, you can find them under the “Undergraduate Research” category here.
Did you just wrap up a senior thesis? Are you getting started on an astro research project? If you, too, have been working on a project that you want to share, we want to hear from you! Think you’re up to the challenge of describing your research carefully and clearly to a broad audience, in only one paragraph? Then send us a summary of it!
You can share what you’re doing by clicking on the “Your Research” tab above (or by clicking here) and using the form provided to submit a brief (fewer than 200 words) write-up of your work. The target audience is one familiar with astrophysics but not necessarily your specific subfield, so write clearly and try to avoid jargon. Feel free to also include either a visual regarding your research or else a photo of yourself.
We look forward to hearing from you!
************
Poruri Sai Rahul
Indian Institute of Technology Madras, Chennai, India
http://rahulporuri.github.io/
Rahul is pursuing an integrated BS and MS degree in physics at the Indian Institute of Technology Madras. He’s also the head of the amateur astronomy club, Astro IITM. He did the work below under the guidance of Prof. Anand Narayanan at the Indian Institute for Space science and Technology, Trivandrum, India.
Colors of Quasars from the SDSS DR9
The practice of photometric redshift estimation through multi-band photometry was initially put forth by Baum 1962 but has only become popular and powerful at the turn of the century. The efficiency of these methods depends greatly on the amount of overlap between adjacent filters, which is why photometry using SDSS u, g, r, i, z and 2MASS J, H, K bands has an advantage over the conventional UBVRI photometry.
Colors of Quasars by Richards et al. 2001 is a study of the color-color and color-redshift relationships of 2625 quasars, mostly from the SDSS DR3 catalog. As only part of the original data set was available on the internet, instead of reproducing the results, I worked on extending them using quasar data from the SDSS DR9. Using sql query, I retrieved photometric data on 146,659 quasars and constructed the color-color and color-redshift relations. Variation in the color can be explained using the various emission and absorption lines that are characteristic of quasars. Refer to sec. 4.3 of Richards et al. 2001 for a detailed explanation.
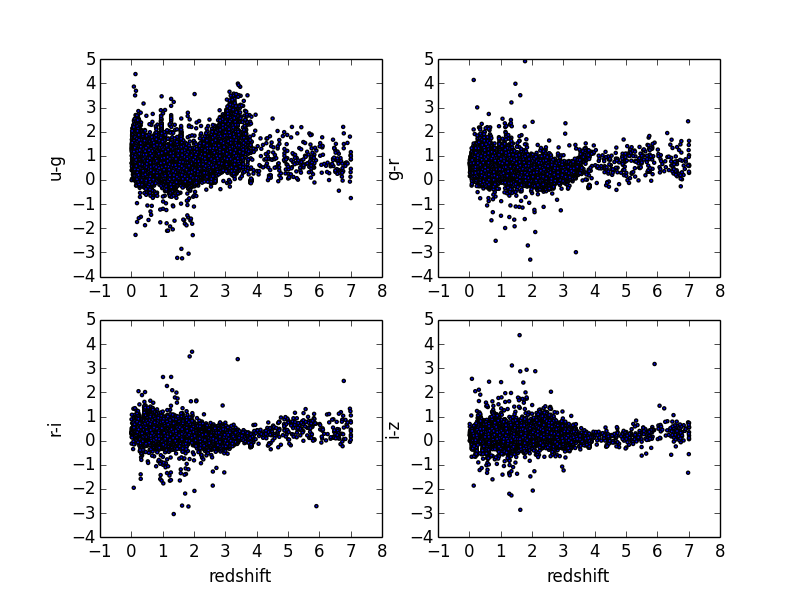
Looking at one of the interesting features, it can be seen that there’s a large scatter in u-g color at high redshifts. As mentioned in sec 4.3, the rapid rise is due to the Lyman alpha forest and lyman-limit systems entering the u band causing there to be little to no flux!
Author