Title: The Distance and Morphology of V723 Cassiopeiae (ADS link)
Authors: J.E. Lyke & R. D. Campbell
First Author’s Institution: W.M. Keck Observatory
Introduction
While theoreticians might work in many dimensions, observationalists must often do their analysis using very few. Distance is notoriously troublesome, but telescopes are always pushing the limits on time, angular, and spectral resolution as well as cadence (how often you look at a source). The burgeoning field of transient astronomy has tantalizing discoveries waiting to be made of both short and long timescale phenomena. To complement large photometric surveys, resolved studies of individual objects provide detailed data that constrain the physics and characterization of these sources. This paper presents observations of a classical nova from two types of spectrographs that determine a distance to the nova and a map of its morphology.
Expanding Shell Distance Measurements
In brief, classical novae have expanding features of hot gas thrown out by a runaway thermonuclear eruption from a white dwarf accreting material from a companion star. Assuming that the material is blown out equally in all directions then the resulting structure would be a shell. Measurements of Doppler shifted spectral lines provide a velocity of this shell and resolved images at multiple epochs give a projected distance that the shell travels. Together the radial and angular expansion velocities provide a distance:
For this measurement, the authors were able to resolve the ejecta and measure velocities for different regions of the material so that they did not have to make the generalizing assumption of spherical symmetry. Rather, by looking at different spectral lines that can trace different energy regimes and spatial regions the authors could extract a detailed map of the ejecta with toroidal and elliptical features. This detail let the authors determine an inclination for the ejecta as well as localize the velocity measurements without having to take multiple observations at different times with different instruments.
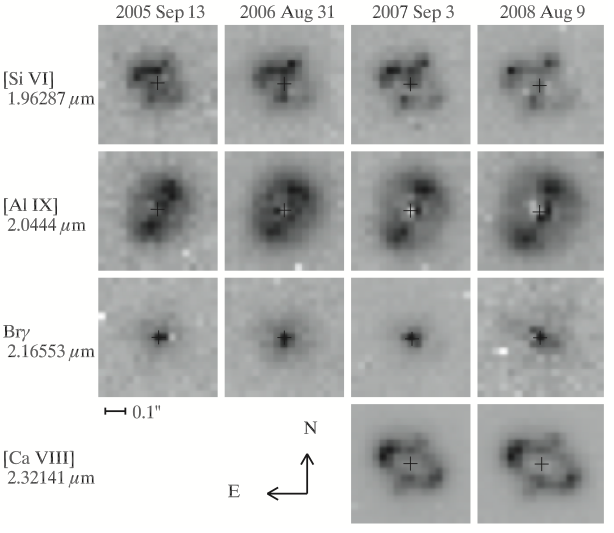
Images of the nova constructed from different emission lines show different structures. The data was taken over the course of 4 years (2005 -2008). Figure 4 from the paper.
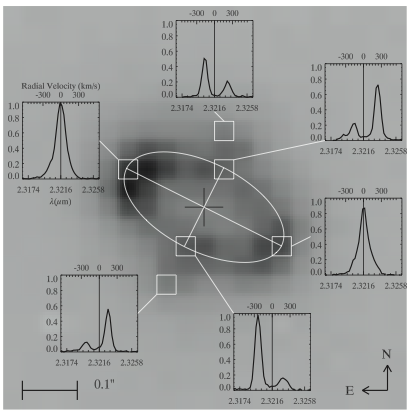
The spectrum of a particular pixel (also called a ‘spaxel’) encode kinematic information about the source. For instance in the figure below you can see how one area of the image is blue shifted while the opposite region is red shifted. These regions correspond respectively to material moving towards and away from us. You can see this in how the strong peaks switch from one side of the line center (the vertical line) to the other. Perhaps you noticed that the regions a bit further out from the north and south ends of the ellipse have the opposite behavior (that is they are blue shifted when the close region is red shifted and vice-versa). The authors attribute this behavior to polar caps of emission. The morphological differences between lines gives insight into various physical mechanisms active in nova.
OSIRIS
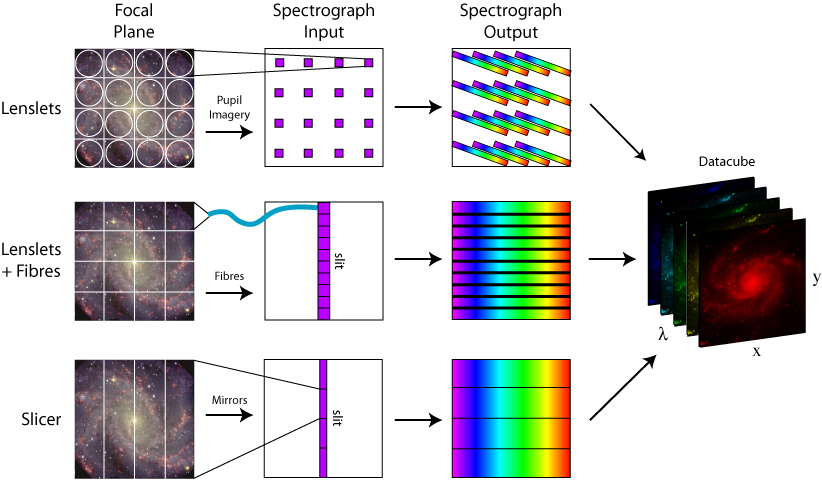
This detailed analysis required using the spectrograph OSIRIS on the Keck II telescope in Hawaii. OSIRIS stands for OH-Suppressing Infrared Integral Field Spectrograph and is an instrument that merges the capabilities of a spectrograph and camera by simultaneously taking many spectra that cover a small region in the sky. There are multiple ways to make an Integral Field Spectrograph (IFS), but the basic principle is to bundle and direct light from different parts of your image into the spectrograph. A careful design ensures that the instrument doesn’t mix together the dispersed light.
This technique generates a 3D data cube of x, y, and lambda (wavelength). Using OSIRIS with Keck’s adaptive optics system, a lucky researcher can obtain diffraction-limited observations of very faint targets. Besides studying novae such as V723 Cassiopeiae, these instruments can be used to look at stellar populations in HII regions or planetary nebulae, map out pre-main sequence objects, and examine galaxies. If you’re interested in learning about more applications of IFS take a look at the the IFS wiki reference page.
Explore this topic further:

Trackbacks/Pingbacks