- Title: A quantitative analysis of stellar activity based on CoRoT photometric data
- Authors: J.C. Hulot, F. Baudin, R. Samadi, M.J. Goupil
- First author’s institution: Institut d’Astrophysique Spatiale, Orsay, France
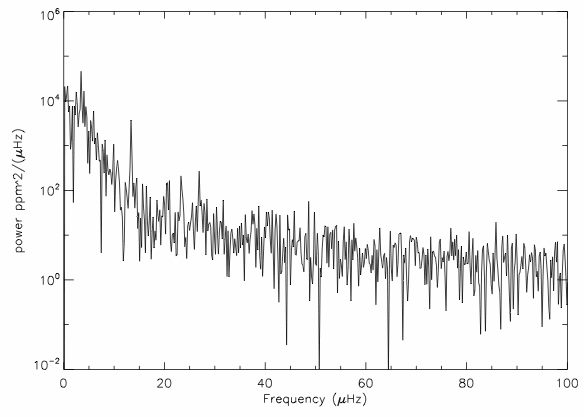
Stellar variability has received more attention recently due to the problems it poses in the detection of exoplanets; however the study of variability is a field of its own. What causes activity? How does magnetic activity vary with different stars? Back in January, I heard several talks on how Kepler data is used to study stellar variability, while Nathan previously posted about the effects of stellar variability on our ability to detect an Earth-like planet using the Kepler satellite. This paper looks at results from another telescope, CoRoT (for Convection, Rotation and planetary Transits). This satellite was launched in December of 2006 with science goals of astroseismology and exoplanet detection. This paper is concerned with the long-term photometric microvariability of stars observed in the pursuit of both these goals. The authors’ approach is to examine the light curves in frequency space, which allows them to discriminate amongst variations on different time scales. Variations over long times scales are thought to result from stellar activity (at least in sun-like stars) and thus the authors are interested in the low frequency variations. A light curve (brightness v. time) represented in frequency space (power v. frequency) is called the power spectrum. An example light curve and power spectrum are shown in the figure below.


TOP: The light curve (brightness variation v. time) for an example CoRoT target. Time is measured in days and the flux variation in parts per million (ppm). BOTTOM: The power spectrum (power v. frequency) for the same object, with frequency in microhertz (1 Hz = 1/s) and power in ppm squared per unit frequency.
Many different factors contribute to the low frequency spectrum. Two are not intrinsic to the star. A linear trend is seen in the data due to changes in the instrument as it gets older; subtracting a linear fit from the data removes this. The second external effect is cosmic ray hits on the detector that result in a sudden jump in the observed brightness that looks like a discontinuity. Light curves where this is evident are removed from the sample. After these two factors are removed, the resulting low frequency spectra are thought to display only intrinsic stellar variability. The general shape of the power spectrum, as can be seen in the above figure, is mostly flat with a rise at frequencies lower than about 15 microhertz. This is the signal expected from small, short-lived, random variations in the star. Several narrow peaks are also seen that likely result from surface features which rotate with the star (i.e. starspots); thus the frequencies at which the peaks are found correspond to the star’s rotational period. Long period oscillations may also explain these peaks.
The authors are most interested in the continuous signal due to microvariability: the “low frequency background.” They remove the peaks and fit the resulting power spectrum to a single, simple equation. The best-fit parameters in this model are used to define a “low-frequency background index”, or LFBI, which is related to the total power in the microvariability spectrum; a higher LFBI indicates a more active star. In addition, they use the previously-discarded rotation peaks to determine the rotational period of the subset of stars for which this is possible. To summarize, the authors used the power spectrum to determine an indicator for stellar activity and, for a subset of stars, the rotation period. The temperatures of the stars are also known.
The authors look for relations between stellar activity, temperature and rotation period. The most active stars are found to be the cooler ones (stars with temperatures down to 4500K are included, corresponding to G and K stars). Rotation period decreases with temperature over the range for which rotation periods are available (5000-7000K). However, no relation between rotation period and activity is found. There is some scatter to these correlations, which the authors suggest could be the result of different metallicities or ages. The results presented in this paper are in agreement with previous work but include a larger range of stellar types. Light curves with longer time spans are needed in order to determine the (potentially long) rotation periods of the lowest mass stars.


Trackbacks/Pingbacks