• Paper title: One Or More Bound Planets Per Milky Way Star From Microlensing Observations (arXiv: 1202.0903)
• Authors: Arnaud Cassan et al
• First Author’s Affiliation: Institut d’Astrophysique de Paris, Paris, France.
• Journal: Nature
Introduction and Motivation
The objective of this paper was to determine the distribution of planets across the entire galaxy, broken down by mass and semimajor axis, from microlensing data. Previous surveys have focused on data from the Doppler (radial velocity) and transit methods, which are both biased to preferentially detect hot, close-in planets. Microlensing, in contrast, is ideally suited for finding cool planets far from their host stars.

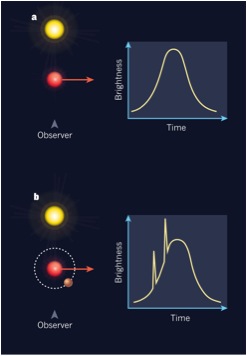
Figure 1: Schematic illustrating the microlensing technique. When one star (the “lens”) passes in front of another, gravitational lensing boosts the light measured from the background star (part a). When a planet is orbiting the lens, and the planet intersects the lens’s Einstein ring, its gravitational field provides an additional boost to the measured intensity that appear as short-duration spikes in the light curve. These additional boosts can be used to find new planets. (Figure from (Chambers 2010))
Figure 1 illustrates the microlensing technique, which depends on the use of a foreground lensing object’s gravity to magnify the light of a background object. When one star (the “lens”) passes in front of another, gravitational lensing amplifies the background star’s light. If this foreground star is orbited by another object (such as a planet), and the object intersects the star’s Einstein ring, its gravity causes an additional spike in the measured intensity from the background object. The duration of lensing events can range from minutes to days, and provides constraints on a planet’s mass, semimajor axis, and period. While these events require precise alignment of two stars, and thus are infrequent, the incredible wealth of information gleaned from them – and their ability to find planets further from their host stars than the transit and radial velocity methods can – makes microlensing an indispensable technique for the planet hunter.
Methods and Results
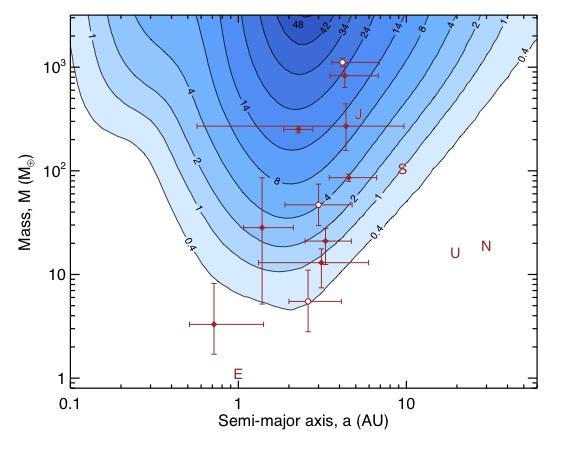
The authors studied the detection rates from the PLANETS microlensing survey from 2002-2007, and then extrapolated the survey’s detection efficiency to probe the galactic planetary distribution function as a function of mass and semimajor axis. As Figure 2 shows, they found the survey to be sensitive to planets with masses ranging from 5 Earth masses to 10 Jupiter masses and semimajor axes ranging from 0.5 to 10 AU – a range of three orders of magnitude in mass but only one in semimajor axis. Thus, this survey provides strong leverage on the mass distribution of exoplanets, but very little on the semimajor axis dependence. What evidence we do have suggests that the detection rate of microlensed exoplanets is not dependent on semimajor axis for this semimajor axis range.

Figure 2: Sensitivity map of the PLANETS survey. The map shows the number of detections assuming every star hosts a planet, with the contours representing lines of equal numbers of detections. White dots are PLANETS detections from 2002-2007, red dots are other microlensing detections, and red letters show the positions of solar system planets on the same diagram. The survey is sensitive across almost three orders of magnitude in mass, but only one order of magnitude in semi-major axis.
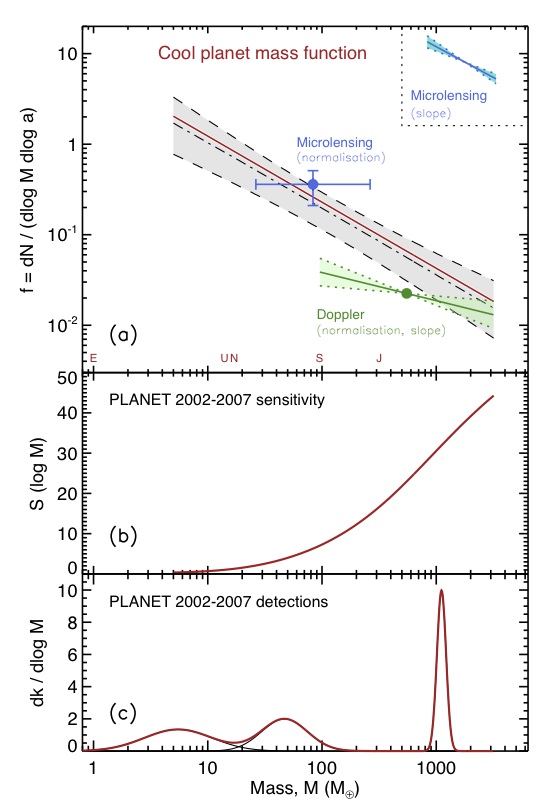
To study the planetary mass function, f, which characterizes the number of planets as a function of mass, the authors fit the observed distribution/distribution from PLANETS with a power law, following the example of work done with radial velocity samples: f=f0(M/M0) α .
To gain increased leverage on the dataset, they used work from previous microlensing studies for the values of f

Figure 3:Figure 3: (a) Power law fit to planetary mass function for microlensing surveys (red line) and radial velocity surveys (green). Shown in blue are the values for the α and normalization f<sub<0 taken from previous studies. (b) Detection efficiency as a function of planet mass. Note that while the surveys are more sensitive to massive planets, most of the planets detected so far are sub-Saturn mass (see Figure 1), in keeping with the hypothesis that small planets are more common. (c) Posterior probability distributions for the three PLANETS detections.
Extrapolating from this model, the authors conclude that on average, ~17% of stars host a Jovian-type planet (0.3-10 Jupiter masses), while ~52% of stars host Neptune-type planets (10-30 Earth masses) and ~62% of stars host super-Earths (5-10 Earth masses). On average, Milky Way stars host 1.6 planets, to an error of about 45%.
This remarkable result reinforces the idea that planetary systems are the rule, not the exception, in our Galaxy. This bodes well for our hope to find habitable worlds, and perhaps even life!

According to wikipedia, there have been 11 planets detected by microlensing. Why does this study only use the planet mass from 3 detections?
And the data stops in 2007; are there ever going to be more detections with usable mass?
Apparently only three planets were detected while the observing strategy of the OGLE / PLANET group was being followed. Several other planets were detected between 2002-2007 (the red points in the figure above). However, if the authors included the other planets, they would have to make some kind of statistical correction for the biases introduced by not following the optimal observing strategy used to detect the ‘good’ planets. I’m sure that would be a complicated mess – so much so that the authors didn’t even attempt it.
On the bright side, even though they only have three usable planets to do statistics with, they are still able to place pretty remarkable constraints on the planet mass function. I’m sure the observations would be even more constraining with more planets.
OGLE and PLANET are still taking data, so I expect that they will be able to improve these constraints in the future.
Hello just wanted to give you a brief heads up and let you know a few of the images aren’t loading
correctly. I’m not sure why but I think its a linking
issue. I’ve tried it in two different internet browsers
and both show the same results.
Hello Marc,
Thanks for your comment! The images seem to be displaying all right when I view the page. Can you tell me which image in particular is not showing up?
Sukrit