Title: Numerical Modeling of the 2009 Impact Event on Jupiter
Authors: Jarrad W. T. Pond, Csaba Palotai, Travis Gabriel, Donald G. Korycansky, Joseph Harrington, Noemi Rebeli
First Author’s Institution: Planetary Sciences Group, Department of Physics, University of Central Florida, Orlando, FL
The impact of comet Shoemaker-Levy 9 was a remarkable event: in 1994, a comet, torn into pieces during a close approach with Jupiter two years prior, crashed into Jupiter. It was the first collision between two solar system bodies to ever be observed, and the effects on Jupiter’s atmosphere (see the figure below) were visible for months. At the time, Harrington et al. (2004) predicted that it would be hundreds of years before such an event occurred again. But two and a half years ago, another object collided with Jupiter. No one witnessed the collision, but amateur astronomer A. Wesley noticed a dark streak with properties closely matching those seen after the impact of SL-9. Because of these similarities, it is believed that this feature was the result of an impact.

Images of Jupiter taken after the 2009 impact. Left (a): An optical image taken with the Hubble Space Telescope. The dark streak (labeled by the crescent and streak and shown in the inset) is the site of the impact. Right (b): An infrared image taken with Gemini-North (http://www.gemini.edu/). The crescent is believed to be associated with ejecta from the impact. From de Pater et al. (2010); see http://adsabs.harvard.edu/abs/2010Icar..210..722D
By comparing the morphology of the 2009 impact site with those of SL-9, Sánchez-Lavega et al. (2010) constrained the properties of the impactor and its orbit. From the direction of the streak and the structure of the crescent (associated with the ejecta), they determined the orientation and angle of impact. Modeling the possible trajectories that could cause such an impact, they give roughly equal weights to two possible origins for the impactor: the Jupiter family of asteroids (having periods of less than 2o years) or the main asteroid belt.
In this paper, Pond et al. present hydrodynamic simulations of the event, from the impactor’s entry to the development of the resulting plumes in Jupiter’s atmosphere. Their goal is to better understand the impact event by modeling several possibilities. They assume an impact angle and latitude based on the analysis of Sánchez-Lavega et al. (2010) but test different physical properties for the impactor. They test two sizes (0.5 and 1 km), two compositions (basalt and ice), and two porosities (resulting in densities between that of pumice and granite, dependent on both the porosity and the composition).

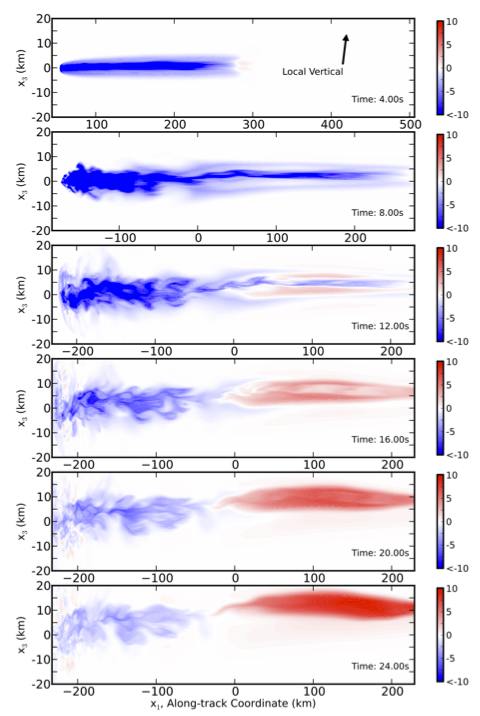
This figure shows the results of their simulation for a 1 km non-porous impactor. Imagine looking down on Jupiter, aligning your view with the direction of impact. The arrow in the first figure points north. Red shows regions where the motion of material is upward (rising plumes) and blue where material is descending into Jupiter's atmosphere. Figure 1 from the Pond et al.
The figure to the left shows the results of their simulation of the 1 km non-porous icy impactor. The blue regions indicate where material in Jupiter’s atmosphere is descending; red where it is rising. The material simulated is a mixture of impactor material and gas in the Jovian atmosphere. As time passes, the impactor sinks and diffuses into the atmosphere. Significant concentrations of impactor material exist only in the top two panels.
In the first panel, four seconds after impact, the material from the impactor is descending into the Jovian atmosphere. A shock front develops around the impactor material, forcing it to continue its descent in the direction of its entrance into the atmosphere. In this panel, most of the material is from the impactor. In the second panel, eight seconds after impact, the impactor has begun to break up and decelerate. By this time, most of the material is atmospheric. In the third panel, twelve seconds after impact, an upwards-traveling plume begins to form downstream from the final impact site. Most of the impactor material reaches its final depth between 16 and 24 seconds after impact, in the 4th and 5th panels. The terminal depth varies from tens (for the 0.5 km icy impactor) to more than a hundred kilometers (for the 1 km basalt impactor) beneath the altitude where the pressure is 1 bar. By 24 seconds, the plume (which is larger for the 1 km impactors than it is for the 0.5 km impactors) has strengthened and drifted to the north.
How can these simulations help constrain the properties of the impactor? Pond et al. report that de Pater et al. (2010) and Orton et al. (2010) found that ammonia was kicked up into the atmosphere by this impact. Therefore, the impactor must reach sufficient depth that the plumes include material from the ammonia ice cloud level of Jupiter’s atmosphere. The authors use this constraint to rule out the 0.5 km icy impactors because they do not reach the required depth.
Through simulations like these, we can explore the possible properties of the impactor. By comparing simulations to the observations of the aftermath of the impact, we might be able to figure out what kind of object hit Jupiter, unseen, on July 19th, 2009 and from what part of the Solar System it came.


