- Title: Structural Variation of Molecular Gas in the Sagittarius Arm and Inter-Arm Regions
- Authors: Sawada, Tsuyoshi; Hasegawa, Tetsuo; Sugimoto, Masahiro; Koda, Jin; Handa, Toshihiro
- First author’s institution: Joint ALMA Office, Chile
Monty Python muse about our place in the Milky Way galaxy in a clever way in the song “The Galaxy”:
Our galaxy itself contains 100 billion stars
It’s 100,000 light-years side-to-side
It bulges in the middle, 16,000 light-years thick
But out by us it’s just 3000 light-years wide
We’re 30,000 light-years from galactic central point
We go round every 200 million years
And our galaxy is only one of millions of billions
In this amazing and expanding universe

Large Magellanic Cloud Over Easter Island (Credit & Copyright: Stéphane Guisard (Los Cielos de Chile), TWAN)
But, being inside the Galaxy makes it difficult to visualize from many perspectives, in some aspects. We can observe other, presumably similarly-shaped galaxies, like Andromeda, and see the incredible spiral structure, or we can observe the nearby (it’s all relative in astronomy) Magellanic clouds to study composition and components of molecular gas clouds, but until we can escape our Galaxy and take a look from the outside, astronomers have to get somewhat more creative to summarize the structure of our neighborhood.
Several surveys in the 1980s showed the large-scale distribution of molecular gas clouds in the Milky Way Galaxy. For example, Larson (1981) and Sanders et al (1985) have shown that there is a relation between the spread of gas velocities in a cloud, and the size of the cloud (this is called a “linewidth-size relation”). In other words, gas is moving more chaotically in larger regions.
Understanding the distribution, structure, and physical conditions of molecular gas in our Galaxy is important in studying star formation, because stars form in these dense molecular regions, mostly in clusters of many stars forming from the same gas cloud. Sawada et al. use recent, high-quality observations to study a representative sample of the molecular gas in the Galaxy, and they determine that the diffuse gas, which was previously missed in observations that only targeted dense gas clumps, is an important contribution to the total gas properties in the Milky Way.
Observations: The authors used the Nobeyama (Japan) Radio Observatory 45-m telescope, to observe carbon monoxide emission with a wavelength of about 3 mm (a frequency of about 115 GHz). They also observed CO emission at a higher frequency using the Atacama (Chile) Submillimeter Telescope Experiment (ASTE). Why CO? Although CO is not the most common molecule in molecular clouds, CO has the advantage that in very cool regions, it is chemically pre-disposed to emit light with a higher probability than the molecular Hydrogen which dominates (in number) in these regions.
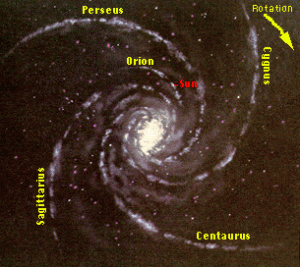
Diagram of the Milky Way spiral galaxy, with its "arms" labeled. This study observed the Sagittarius (Sgr) arm, and the "inter-arm" region, between the labeled arms, as viewed from the Earth (approximately at the label "Sun"). Imagine drawing a line between the words "Sun" and "Sagittarius". (Image credit: NASA)
Sawada et al. carefully chose to observe a region of nearly one square degree in a direction (called a line of sight) that would sample several components of the Milky Galaxy, in all its spiral splendor. See the figure to the left to visualize the spiral structure of the Milky Way, and how to view several components with one observation. Specifically, the line of sight intersects the Sagittarius (Sgr) arm twice, plus the inter-arm region. Thus, if molecular gas has different composition in these regions, the observations should detect different intensities of gas emission. How do they separate the contributions from different components of the Galaxy? Due to the rotation of the Milky Way, these components with different radial velocities relative to us can be separated by the Doppler shift (a nice explanation can be found here) of the emission.
Results: The authors present velocity-channel maps, in other words they show how much emission is contributed by gas at discrete velocities. They find that emission changes with velocity, and specifically low-brightness widespread emission is prevalent at low velocities (coming from gas in the solar neighborhood), while bright and confined clumpy structure is found at mid-velocities, and then widespread emission spreads over field at higher velocities. The bright, clumpy structures they call the “B” component, and conclude that it is confined to the spiral arms (based on the radial velocities). The diffuse, dim emission, on the other hand, is called the “D” component, dominating at a range of velocities, and likely contributing nearly half the mass of molecular gas. Previous studies likely missed this gas because of its lower brightness and less clumpy structure.
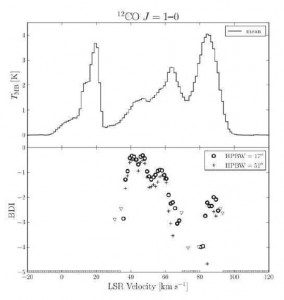
Spectrum of CO (top), and Brightness Distribution Index (BDI, bottom). The spectrum shows the brightness of gas emission at each velocity, so that the peaks show several velocity components of distinct gas regions. The bottom BDI represents the ratio of bright, dense gas and lower-brightness, diffuse gas at each velocity. The regions with higher BDI have warmer gas, and are found in the spiral arm, where most star formation occurs. Sawada et al. (2012) Figure 9.
To visualize and quantify the different gas structures, the authors create the “Brightness Distribution Function (BDF)”, which reflects spatial structure of the B- and D-components. The structure is shown to be different when considering gas from the Sgr arm and the inter-arm region. The “Brightness Distribution Index (BDI)” is one number (the slope) to characterize the BDF, and can be thought of as the ratio of bright (dense, clumpy) and low-brightness (diffuse) emission coming from gas with different velocities (in different regions along the line of sight).
Conclusions: The B-component (bright, dense, clumpy structure) is found predominantly in the spiral arms of the Galaxy, while the D-component (diffuse gas) is widespread and dominates in the inter-arm region. The BDI gives a flux (by proxy, mass) ratio between these two components, and is a quantity that these authors introduce as a way to characterize the distinct gas structure of different components in the Galaxy. Regions with high BDI are likely warmer, and coincide with regions of ionized hydrogen gas.
Moreover, this gas is found in one particular part of the spiral arms, called the “downstream side”, and this is likely the site of most star formation. This is the outer side of the spiral arm, where the gas revolves slightly faster than the typical spiral arm velocity. Think of joining hands with your friend as you circle the skating rink, in which case the person on the outer edge is whipped around at a faster rate. This enhanced velocity, for the case of molecular gas in the Milky Way arms, may be the necessary component to spark star formation.



Trackbacks/Pingbacks