- Title: Evidence for the disintegration of KIC 12557548 b
- Authors: M. Brogi, C. U. Keller, M. de Juan Ovelar, M. A. Kenworthy, R. J. de Kok, M. Min, and I. A. G. Snellen
- First author’s institution: Leiden Observatory, Leiden University
Background
You might remember reading about the rather strange Kepler target KIC 12557548 on astrobites earlier this year. In previous astrobites, Caroline Morley and Dan Gifford explained that the star shows a periodic transit-like dip once every 15.7 hours, but that the depth of the dip varies. Planets should not change size on orbital timescales, so the rapid variation in the transit depth presented a puzzle. The authors of the discovery paper (Rappaport et al. 2012) proposed two possible explanations for the odd variations in transit depth:
- The transiting planet is being gravitationally perturbed by another planet and sometimes grazes the edge of the star without fully blocking the disk.
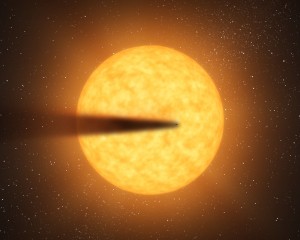
- The planet is so close to the star that the surface is evaporating into space and forming a trailing cloud of debris.
If perturbing planet explanation is correct, then the transit depths and times should vary in a predictable fashion. However, Rappaport et al. found no evidence for transit timing variations and no periodicity in the transit depth variations, so the first explanation is ruled out. In the evaporation model, the transit depth varies because the orientation of the cloud with respect to the observer and the fraction of the star that appears blocked is slightly different during each transit. The authors of the first paper favored the evaporation explanation and performed an initial simulation of the dust tail.
What’s New?
In this paper, Brogi et al. revisit the original Kepler data to independently test the dust cloud interpretation proposed by Rappaport et al. in the discovery paper.They find that their model accurately reproduces four anomalies noted in the transit light curve (see figure below):
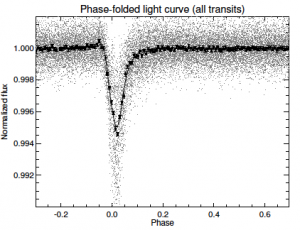
The odd transit-like light curve of KIC 12557548b. The gray points are the Kepler data, the black line is the model, and the solid squares are binned data. Note the varying depths, the asymmetry, and the slight brightening just before transit. Figure 1 from Brogi et al. 2012.
- The transit depth varies depending on the geometry of the dust cloud during each transit.
- The dip in brightness at the start of transit (ingress) is significantly shorter than the increase in brightness at the end of transit (egress). Transit egress should last longer than ingress because the dust cloud extends outward behind the planet.
- There is a slight rise in brightness just before transit. The spike in brightness can be explained by forward scattering off the dust grains.
- The system has a period of 15.7 hours, but the transits “disappeared” during an 8-day period in Quarter 2. The lack of observed transits can be explained by the dust model if the planet is smaller than 1.15 Earth radii because the dip due to such a small planet passing in front of the target star would not have been detectable given the precision of the light curve.
The planet size limit implies that the transits are only detectable when the dust cloud blocks part of the star–the planet by itself blocks such a small fraction of the star that the change in brightness is not detectable. During that 8-day period in Quarter 2, the system must have been aligned such that the dust cloud did not cross in front of the star from Kepler’s perspective.
The Details
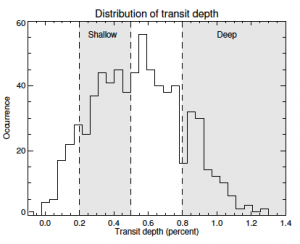
Distribution of transit depths. The shaded regions mark the shallow and deep transit samples. Figure 2 from Brogi et al. 2012.
Brogi et al. downloaded all of the publicly available data for the target star and processed the data to remove systematics and stellar variability. They then folded the data to the 15.7 hour orbital period found by the discovery authors and fit a single model to all transits to determine the inclination of the system and the distance of the dust cloud from the star. Next, they used their best-fit inclination and distance to re-fit each transit individually to determine the depth of each transit. The resulting distribution of transit depths is shown in the figure at right.
Brogi et al. subdivide the transits into a “shallow transit” group and a “deep transit” group (shaded in gray) and fit a separate model to each group. They determine that the only significant difference between the two populations is the transit depth. Next, the authors construct a dust model assuming that the cloud is on a circular orbit and use the equations of radiative transfer to calculate the scattering and extinction caused by the dust cloud at each phase of its orbit around the star for a variety of cloud and transit properties. They determine the best-fit cloud and transit properties by running a Markov Chain Monte Carlo algorithm to fit the dust models to the observed light curve.
Brogi et al. find that the dust cloud model nicely reproduces the features of the Kepler data. The authors tentatively suggest that the dust grains have an average size of 0.1 microns, but multi-wavelength observations and more frequent Kepler observations (1 minute cadence instead of 30 minute) are required before the authors can determine the composition of the grains. This fascinating object has already spurred two papers within the last year, so watch out for more papers about KIC 12557548b using the new Quarter 7-9 data released on July 28 and the Quarter 10-12 data scheduled to be released on October 28.

Trackbacks/Pingbacks