- Title: Comparative Modelling of the Spectra of Cool Giants
- Authors: T. Lebzelter, U. Heiter, C. Abia, K. Eriksson, M. Ireland, H. Neilson, W. Nowotny, J. Maldonado, T. Merle, R. Peterson, B. Plez, C. I. Short, G. M. Wahlgren, C. Worley, B. Aringer, S. Bladh, P. de Laverny, A. Goswami, A. Mora, R. P. Norris, A. Recio-Blanco, M. Scholz, F. Thevenin, T. Tsuji, G. Kordopatis, B. Montesinos, R. F. Wing
- First author’s institution: University of Vienna
The Big Picture

Just as some people see a duck and others see a rabbit, astronomers using different stellar models and analysis methods find different properties for stars. (Credit: mindfake.com)
Unsurprisingly, Lebzelter et al. found that the choice of stellar model and analysis method does influence the derived stellar parameters. Some of the differences among the results can be attributed to the different absorption lines incorporated by the different teams, but the situation is decidedly complicated. Modelers are working hard to improve the consistency across models and between models and reality, but in the meantime Lebzelter et al. recommend conducting differential analyses in which astronomers compare observations of their target star with observations of a similar star that has been well-characterized.
The Experiments
Three of the paper authors (Heiter, Lebzelter, & Nowotny) devised an experiment in which stellar modelers would be presented with the identical data sets for several stars and asked to independently derive parameters for the stars in question. The organizers enlisted fourteen different teams of stellar modelers (the other authors) and gave each team high-resolution and high-quality spectra of two real cool giant stars and two computer-generated model stars. The teams were also supplied with broad-band photometric data (the brightness of the star over broad wavelength chunks) for each of the four model stars. After receiving the data, the teams had several weeks to analyze the data using the method of their choice and derive parameters for one or more of the stars before traveling to the University of Vienna for a workshop to discuss their results with the other teams.
During the workshop in Vienna, the authors decided to run a second experiment as well. In the second experiment, each team was given the input parameters for a metal-poor cool giant star and asked to compute a spectrum using their favorite stellar model code. The authors then compared the spectra to see how the strengths of various atomic and molecular features varied depending on the choice of code.
Results from Experiment 1
In the first experiment (deriving stellar parameters from spectra), all of the authors identified the mystery stars as cool giants, but the specific metallicities (fraction of heavy elements compared to hydrogen), surface gravities, and temperatures of the stars differed slightly depending on the models used. The figure below compares the best-fit stellar parameters found for one of the two real giant stars. This star happens to be Aldebaran, a bright red giant star in the constellation of Taurus the bull. Aldebaran is one of the brightest stars in the sky and you’ve probably seen it yourself if you live in the northern hemisphere.

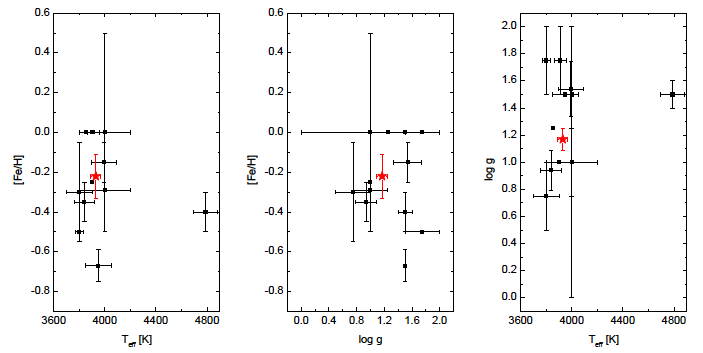
The temperatures, surface gravities, and metallicities found for Aldebaran. The values from each team are plotted in black and the best "direct" parameters are shown in red. Figure 11 from Lebzelter et al. 2012.
As you can see from the figure, the teams each found a different set of parameters for Aldebaran. The black points with error bars are the values reported by each of the teams and the red stars are the best known “direct” parameters for Aldebaran. The “direct” parameters were computed from the measured angular diameter, distance, and bolometric flux of the star rather than from stellar atmosphere models, so they should more accurately reflect the true attributes of the star. (Stay tuned for a future astrobite with a more in-depth explanation of direct stellar measurements.) According to the “direct” parameters, Aldebaran has a temperature of 3930K, a surface gravity of 1.2, and a sub-solar metallicity of [Fe/H]=-0.22. With the exception of the one team that found a much hotter temperature for Aldebaran, all of the temperatures are consistent within their reported error bars. This is encouraging news because it implies that temperatures might not depend too much on the particular choice of stellar model for cool giants.
The situation is more complicated for metallicity and surface gravity, however. The metallicities found for Aldebaran are clustered around the “direct” value, but the metallicities found for the other three test stars were less reliable. One of the test stars was actually less metal-rich than the Sun, but all of the teams reported solar or super-solar metallicities for that star. Looking at the surface gravity plot for Aldebaran, half of the teams report surface gravities that are too high (the cluster of points at the top of the right panel) and half report values that are a little too low. The spread in surface gravities is similar for the other three stars.
Results from Experiment 2
In the second experiment, the authors were tasked with recreating the spectrum of a star given a set of stellar parameters. The spectra produced by the various teams agreed well for the strong atomic lines, but the strength of the weaker lines varied from team to team. The spectra also displayed large differences at infrared wavelengths and variable strengths for certain molecular features. These discrepancies are part of the reason why the modelers found different parameters for the stars examined in the first experiment.
Conclusions
As you might have expected, the authors found that astronomers using different stellar models and analysis methods will arrive at different stellar parameters even if they start from the same data set. Lebzelter et al. did not notice any systematic offsets from fitting data using different models, which indicates that the situation is more complicated that simply offsetting the results from one set of models by 50K. A good starting point would be to develop a master list of absorption lines to be shared by the whole stellar modeling community, but much further work will be necessary before the results from different stellar models converge.


This is a nice summary of the paper!
Just to clarify a point which was not made clear enough in the paper: Unlike surface temperature and gravity the reference metallicities of the two “real stars” are not “direct” measurements. They were determined by previous authors in a similar way as in the paper, using stellar atmosphere models.