Title: The Milky Way’s Circular-velocity Curve between 4 and 14 kpc from APOGEE data
Author: Jo Bovy, Carlos Allende Prieto, Timothy C. Beers, et al.
Institution: Institute for Advanced Study, Princeton, NJ
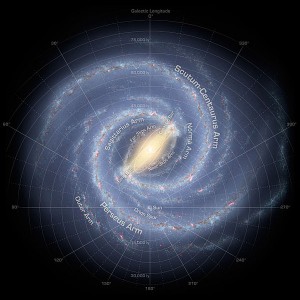
Artist’s conception of a top-down view of our Milky Way, based on infrared images from NASA's Spitzer Space Telescope (Photo credit: NASA/JPL-Caltech/R. Hurt)
Right now, as you are reading this, you might think that you are sitting still. But of course the earth underneath you is spinning at a rate of almost 500 m/s. We are orbiting around the Sun with a speed of about 30 km/s. And as if that is not enough, the solar system is whipping around the center of our Galaxy at a velocity of 260 km/s… or is it? As the authors of today’s paper show, the speed of our Sun around the Galaxy is a difficult measurement to make, with important implications for the mass of our Galaxy.
Measuring the galaxy we live in:
From our vantage point inside of a spiral arm of the Milky Way, it is hard to construct a global picture of our Galaxy. Unfortunately, if we want to know more about the galaxy we live in, we cannot just hop 30,000 light years outside and take a video that would show us exactly how our galaxy is shaped, how far away from the central supermassive black hole we are, and how fast our Sun is orbiting. One thing we can do however is make a rotation curve. This diagram, which shows how fast the stars and gas in a galaxy are moving as a function of their distance from its center, contains a lot of information about a galaxy’s size, structure, and total mass.
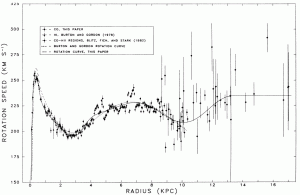
The Milky Way’s rotation curve, showing the speed at which the stars and gas orbit around the center of the galaxy as a function of their distance from the center. Figure reproduced from Clemens (1985), ApJ 295, 422.
For example, rotation curves of galaxies show us that the rotation speed in the outer parts of galaxies is almost uniformly constant, which means (thanks to Kepler’s third law) that the total mass contained inside of a galaxy greatly increases as you go outward (even as its luminosity decreases to almost nil). Rotation curves provided the first indication that a non-luminous form of matter– dark matter— is the dominant mass in galaxies.
A new value of the local circular velocity:
Because the measured rotation speed for our Galaxy has important implications, not just for measuring its total dark matter mass, but also for determining more accurate kinematic distances, constraining how the disk of our Galaxy formed, and comparing the properties of our Galaxy with others, the authors of this paper have worked to refine the measurements of our Galaxy’s local rotation curve. Using an infrared sample of more than 3000 nearby stars from APOGEE, a spectroscopic survey of the inner galaxy, they measure their line-of-sight velocities. So how does this translate into a local rotation curve?
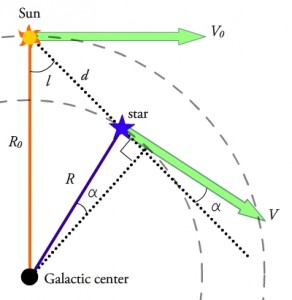
The authors of this paper measure V for a sample of stars in order to make a model of our galaxy which predicts R0, the distance to the galactic center, and V0, the local solar velocity (which is about 26 km/s different than VC, the average circular velocity of nearby stars at about the same distance as the sun.) Image credit: Wikipedia
There are several things to think about here. First, both the stars they measure and the Sun are orbiting separately around the galaxy, and the Sun’s velocity relative to these stars must be corrected for. Even trickier, the Sun’s velocity is offset from the circular velocity (VC) of nearby stars at the same distance as us from the Galactic center. Thus, the orbital speed of our Sun around the galaxy is not the same thing as the the average stellar velocity at our Galactic radius, which is the value reported in a rotation curve. Finally, because the authors of this paper are measuring the motions of relatively old stars, they also have to consider the random velocities all the stars they observe have acquired over their lifetimes (compared to the velocity of the disk gas in which they formed, which is representative of the true rotation pattern of the galaxy).
Taking this all into account, the authors fit the measured stellar velocities to a model of our Galaxy as a rotating disk that includes all of these different contributions to the measured velocities, and solve for the best-fit rotation curve, as well as the parameters R0 (the distance to the Galactic center) and VC.
VC, the value of the rotation curve at our Galactic radius, has recently become a controversial value. A recent study measured VC = 250 +/- 30 km/s, 15% higher than the previously established value. Now a 15% increase in speed may not sound like a big difference, but it is enough to increase the estimated mass of our entire galaxy by 50%. Suddenly our galaxy weighs a little over one trillion times the mass of the sun, and the Andromeda galaxy (with a mass of 1.2 trillion solar masses) seems like an equally matched opponent we could handle in a fight (more about their upcoming collision can be found in this astrobite). The authors of this paper however suggest that a lower value is most likely correct, measuring VC = 218 +/- 6 km/s.
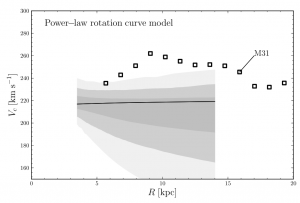
The black line shows the new best fit for the local rotation curve of the Milky Way from Figure 6 of Bovy et al. (ApJ 2012). The shaded region show the 1-,2-, and 3-σ uncertainties. In comparison, the rotation curve of the Andromeda Galaxy (M31, boxes) is much higher, indicating that Andromeda has a higher enclosed mass.
They also measure a solar rotational velocity of ~242 km/s, and derive a total Milky Way mass of 800 billion solar masses. Analyzing the systematic uncertainties of their study, they find VC < 235 km/s with greater than 99% confidence. Previous, higher measurements of VC are explained as being due to a different correction for the offset of the sun’s velocity with respect to VC. Their new measurement of the offset, 26 km/s, is 14 km/s larger than the previous estimate, which accounts for most of the discrepancy with prior results.
So, thanks to these new measurements, it looks like our Milky Way is put firmly back into second place in our local group of galaxies, behind massive Andromeda. But at least remember that we’re not taking this sitting down. Right now, we are all sprinting around the center of our galaxy at over 240 km/s. And that is still pretty fast.


Trackbacks/Pingbacks