- Title: The Apache Point Observatory Galactic Evolution Experiment (APOGEE)
- Authors: Steven R. Majewski, Ricardo P. Schiavon, Peter M. Frinchaboy, et al. (there are more than 70 co-authors)
- First Author’s Institution: Dept. of Astronomy, University of Virginia, Charlottesville, VA (there are 50 institutions represented among the authors)
- Paper Status: Submitted to The Astronomical Journal
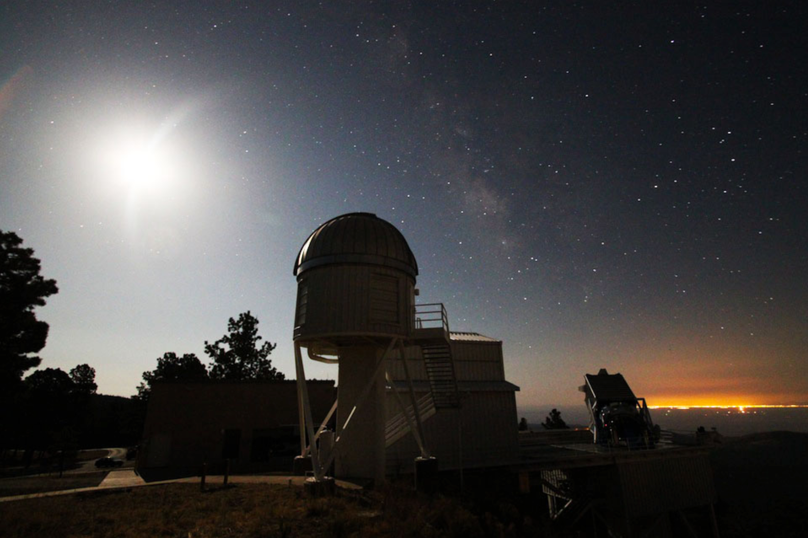
Apache Point Observatory in Sunspot, NM. The SDSS 2.5-m telescope is to the right, pointing toward the center of the Milky Way. The full moon and light pollution from nearby El Paso don’t stop APOGEE! Figure 15 in the paper.
What’s black, white, and re(a)d all over… and spent three years looking all around the sky? It’s APOGEE (the Apache Point Observatory Galactic Evolution Experiment), a three-year campaign that used a single 2.5-m telescope in New Mexico to collect half a million near-infrared spectra for 146,000 stars!
Black and white? As shown below, the raw spectra from APOGEE look black and white, but appearances can be deceiving. Each horizontal stripe is the spectrum of one star, spanning a range of colors redder than your eye can see. To get the spectra nicely stacked in an image like this, fiber-optic cables are plugged into metal plates which are specially drilled to let in slits of light from individual stars in different regions of the sky. Each star gets one fiber, which corresponds to one row on the detector. An image like this allows APOGEE to gather data for a multitude of stars quickly.
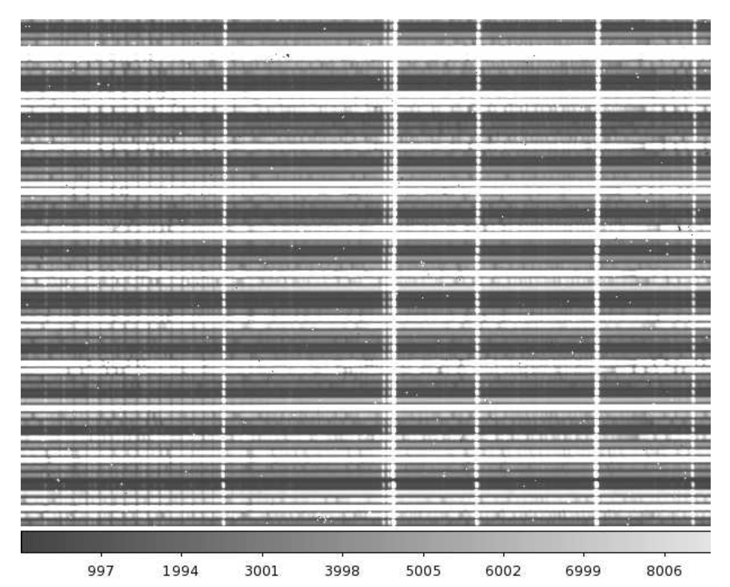
Part of a raw 2D APOGEE image from observations near the bulge of the Milky Way. Each horizontal stripe is a portion of one star’s near-infrared spectrum. The x-axis will correspond to wavelength once the spectra are processed. Bright vertical lines are from airglow, dark vertical lines common to all stars are from molecules in Earth’s atmosphere, and the dark vertical lines that vary from star to star are scientifically interesting stellar absorption lines that correspond to various elements. Fainter and brighter stars are intentionally interspersed to reduce contamination between stars. Figure 14 in the paper.
Re(a)d all over? Today’s paper accompanies the latest public data release, DR12, of the Sloan Digital Sky Survey (SDSS), a large collaboration which includes APOGEE. So in addition to focusing on red giant stars viewed in near-infrared light, all the APOGEE data are now freely available and may be read by anyone. Even so, the APOGEE team has been hard at work.
Probing to new galactic depths with the near-infrared
APOGEE is designed to primarily observe evolved red giant stars in the Milky Way using near-infrared light. What’s so special about this setup? First, red giants are some of the brightest stars, so it’s possible to see them farther away than Sun-like stars. Second, near-infrared light doesn’t get blocked by dust like visible light does, so it lets APOGEE observe stars toward the center of the Milky Way, which is otherwise obscured with thick dust lanes. This is really important if you want to understand how different stellar populations in the galaxy behave.
Mapping velocities and composition
Because APOGEE collects spectra of stars, not images, each observation contains lots of information. Spectra tell us how fast a star is moving towards or away from us (its radial velocity), how hot a star is, what its surface gravity is like, and what elements it is made of. Lots of work has gone into developing a pipeline to process the spectra and return this information reliably, because it’s not practical to look at hundreds of thousands of observations by hand.
APOGEE visits each star at least three times to check if it is varying for any reason. (For example, binary stars will have different radial velocities at different times, and the APOGEE team wants to exclude binaries when they use star velocities to measure the overall motion of the galaxy.) The figures below show how a subset of stars mapped by APOGEE vary in radial velocity (top) and chemical composition (i.e., metallicity, bottom). The stars in both figures lie within two kiloparsecs above or below the disk of the Milky Way, so we are essentially seeing a slice of the middle of the galaxy. Observations don’t exist for the lower right quadrant of either figure, because that region is only visible from Earth’s southern hemisphere.
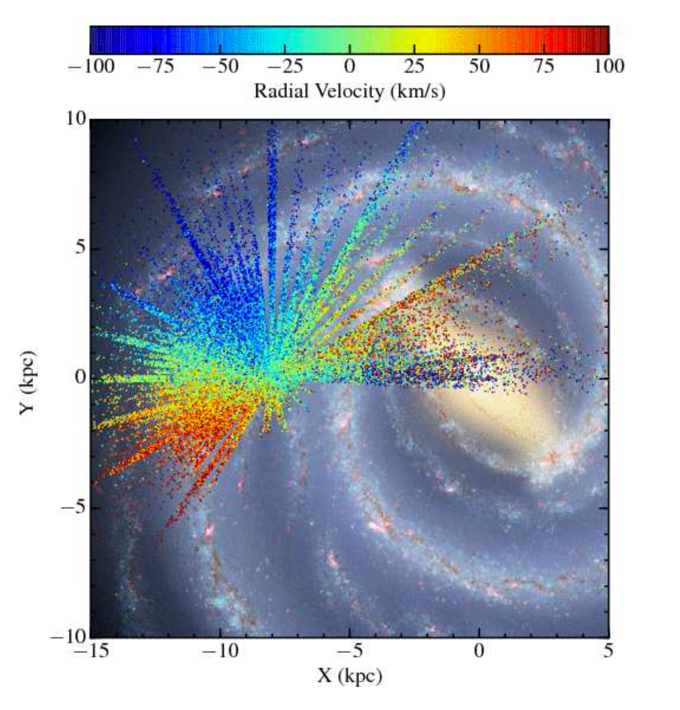
A map of stars observed by APOGEE, color-coded by radial velocity. The Sun is located at the center of the “spoke” of observations, and is defined as having zero radial velocity (greenish). An artist impression of the Milky Way is superimposed for context. This figure illustrates how the galaxy as a whole rotates. The Sun moves with the galaxy, and other stars’ relative motions depend on how far in front or behind of us they are. This astrobite has more details. Figure 24 from the paper.
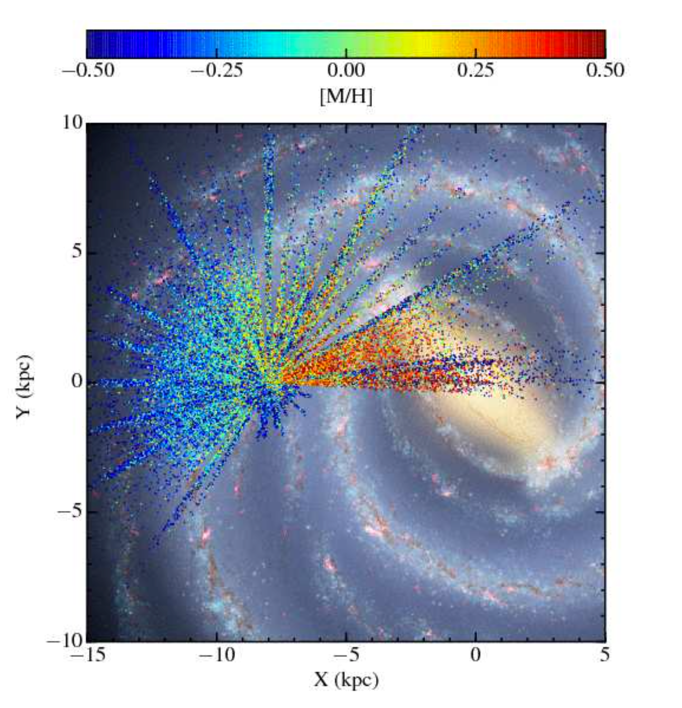
A map of stars observed by APOGEE, color-coded by metallicity. As above, the Sun is in the center of the observation “spokes” and an artist impression of the Milky Way is superimposed for context. The Sun is defined to have 0 metallicity (greenish). Stars that are more chemically enriched than the Sun are red, and stars that are have fewer metals than the Sun are blue. This figure illuminates an overall galactic metallicity gradient. Figure 25 from the paper.
Together, maps like these provide an unprecedented look into our galaxy’s past, present, and future by combining kinematics and the locations of stars with different chemistry. Thanks to APOGEE’s success, plans are now underway for APOGEE-2 in the southern hemisphere using a telescope in Chile. This treasure trove of data will undoubtedly be put to good use for years to come.
Author