- Title: Finding binaries among Kepler pulsating stars from phase modulation of their pulsations
- Authors: Simon J. Murphy, Timothy R. Bedding, Hiromoto Shibahashi, Donald W. Kurtz and Hans Kjeldsen
- First Author’s Institution: Sydney Institute for Astronomy, School of Physics, University of Sydney, Australia and Stellar Astrophysics Centre, Department of Physics and Astronomy, Aarhus University, 8000 Aarhus C, Denmark
- Paper Status: Accepted for publication in MNRAS
One astronomer’s noise is another astronomer’s data. Planet hunters discard pairs of stars as they sift through data from the Kepler space telescope, while stellar astronomers ignore pesky planets and study their colleagues’ so-called “false positives.”
Kepler‘s primary goal is to find Earth-sized exoplanets orbiting distant stars. However, today’s paper uses Kepler data to study binary stars rather than transiting planets. You can learn a lot just from the light curves of eclipsing binaries, a special case when one star passes in front of the other from our point of view. But there are two problems. First, not all binaries eclipse, and second, you need a way to measure the stars’ radial velocities to get a complete physical model. The second problem is traditionally solved with spectra: individual absorption lines in a star’s spectrum appear Doppler shifted toward blue or red as the star moves towards or away from us in its orbit.
Spectra, while powerful, are a bottleneck. It takes several minutes with a large telescope to measure a single velocity data point for one binary, and we can only start these tedious observations once we know which stars are eclipsing binaries to begin with. This brings us back to the first problem! We are missing out on a lot of really interesting binary stars.
In this paper, Murphy et al. demonstrate a new way to not only detect binaries we may have missed in the Kepler data, but also to measure their velocities without spectra. The secret lies in starquakes. Or, more properly: pulsation modes measured with asteroseismology.
How do pulsating stars give away their secret identities as binary dance partners? From the paper:
“As a pulsating star moves in its binary orbit, the path length of the light between us and the star varies, leading to the periodic variation in the arrival time of the signal from the star to us. We detected this as a phase variation.”
In other words, sometimes the star’s pulsations arrive sooner or later than they would if it was sitting still in space. This is the same principle used to study X-ray pulsar binaries. To measure this time delay, the authors identify frequencies of several pulsation modes in a star using Kepler data that spans four years. They then track the pulsation phases at those frequencies as a function of time by breaking the data into shorter 10-day segments. If the phases vary with time, the star is a binary, and the phase variations map out the star’s orbit in space. They can take the time derivative of the phase variations to get a radial velocity curve.
To show this method works in a variety of situations, the authors present five examples: a known binary, a long-period binary, a star with pulsations that are weaker than normal, an eccentric binary, and finally, a binary with two pulsating components. They present this novel method and leave a more detailed analysis of individual binaries for future work. Two of the five example cases are shown below.
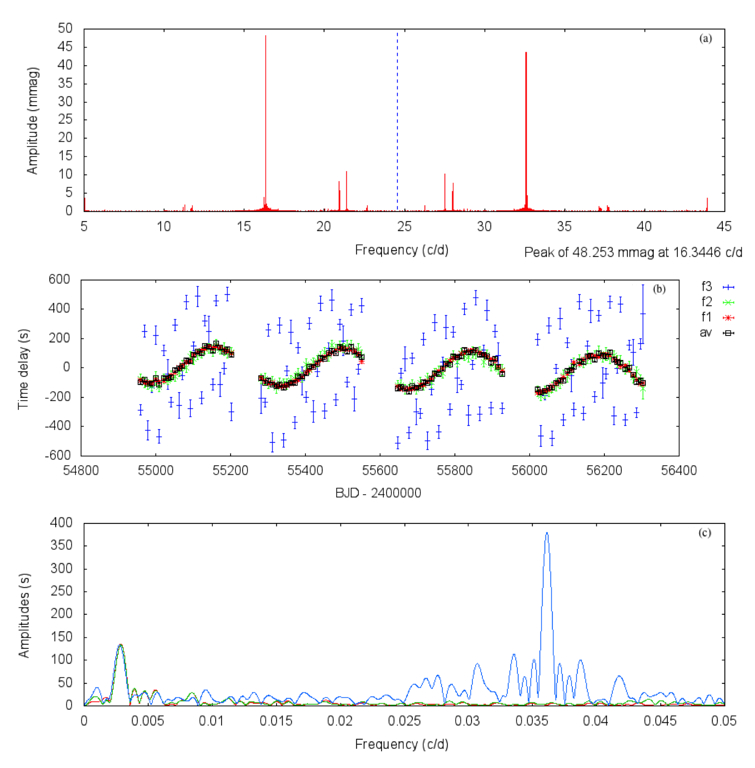
Phase variations for a known binary. Top: amplitude spectrum of the Kepler light curve with spikes for different pulsation frequencies.* Middle: measured phase variations vs. time show consistent time delays for two pulsation frequencies, and a somewhat spurious result for a third frequency (blue) due to poor resolution. Gaps arise because this star fell on a broken part of Kepler‘s sensor 1/4 of the time. Bottom: Fourier transform of the time delays, which reveals the binary’s orbital period is about 1/0.0029 = 344 days.
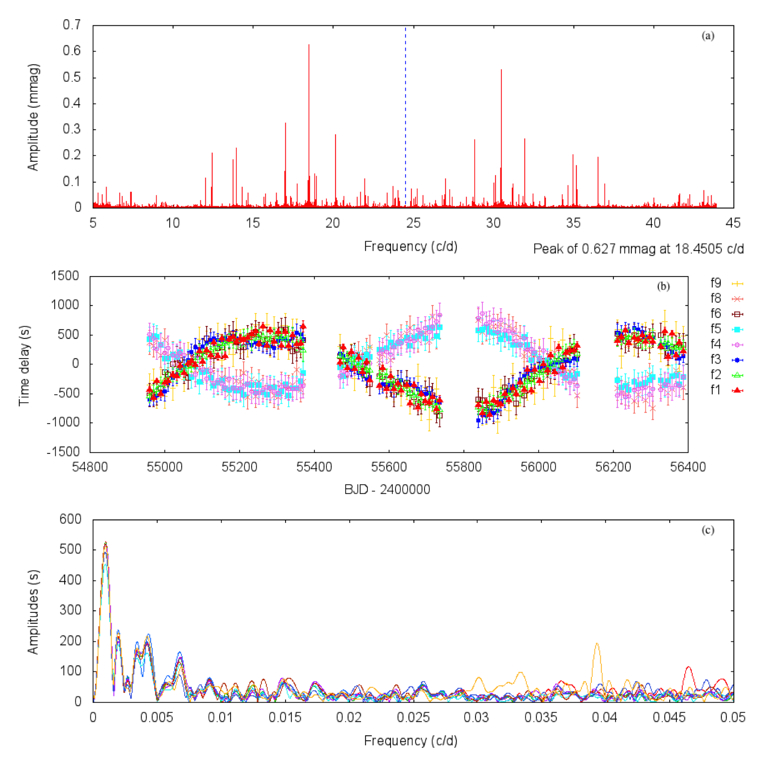
Phase variations for two pulsating stars in a binary. Top: amplitude spectrum of the Kepler light curve with spikes for different pulsation frequencies.* Middle: measured phase variations vs. time show time delays for nine individual pulsation frequencies, whose two sinusoids of opposite phase show they belong to two separate stars. Bottom: Fourier transform of the time delays, which reveals the binary’s orbital period is about 1/0.00104 = 960 days. This fascinating system will be studied in more detail in a followup work.
Thanks to asteroseismology, astronomers can have their cake and eat it too! Not only can they find more binary stars, they can characterize the binaries through clever analysis of the Kepler data they already have.
*The blue line in the top portion of each figure represents the Nyquist frequency. This is the largest frequency that can be reliably measured since Kepler records data every 30 minutes. In these examples, frequency spikes past the Nyquist frequency are reflections of the real pulsations.
Author
Trackbacks/Pingbacks