•Title: Source-intrinsic near-infrared properties of Sgr A*: Total intensity measurements
•Authors: Witzel, G.; Eckart, A.; Bremer, M.; Zamaninasab, M.; Shahzamanian, B.; Valencia-S., M.; Schödel, R.; Karas, V.; Lenzen, R.; Marchili, N.; Sabha, N.; Garcia-Marin, M.; Buchholz, R. M.; Kunneriath, D.; Straubmeier, C.
•First Author’s Institution: University of Cologne
Sagittarius A*
It has been well established using the orbits of stars in Galactic center that a supermassive black hole (SMBH) lies at the center of the Milky Way. While it’s believed that SMBHs lie at the centers of most galaxies, the properties of the SMBH at the heart of the Milky Way are best constrained because of its proximity. In particular, the location of the gravitational potential associated with the SMBH has been shown to coincide with Sagittarius A* (Sgr A*), the bright radio source also located at the center of our Galaxy. Since its initial discovery as a compact radio source in 1974, Sgr A* has been observed in many wavebands including submillimeter (sub-mm), X-ray, and more recently, the infrared (IR).
Observations in all of these wavebands have shown that Sgr A* is a variable source, and that there exist correlations between variabilities at different wavelengths. This means, for example, when a “flare”, or particularly bright state of the black hole, occurs in the IR, it also occurs in both sub-mm and X-ray. These correlated flares suggest, that not only are the variations in the brightness of Sgr A* a real effect, but also that the variability originates very close to the SMBH. The obvious culprit is the SMBH’s accretion disk. The accretion disk is where material collects before falling on to the black hole (and thus leading to its growth). Sgr A*’s growth via accretion has been a popular topic as of late: check out these two astrobites by Susana and this one by Alice if you haven’t already. While the accretion disk surrounding the Milky Way SMBH is likely quite small in comparison to those surrounding SMBHs in some other galaxies, we can observe variations of much smaller magnitude. Thus, the variability of Sgr A* provides and important tool to learn about accretion physics in general.
Defining Variability
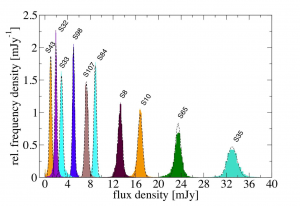
Figure 1: Witzel et al. figure 6. This figure shows the number or measurements verses the brightness of the measurement for several non-variable sources. Variations in the measurements for a single non-variable source are well fit by a gaussian distribution.
Before we go any further, we should talk about how we identify that a source is variable in the first place. If we took several images of a non-variable star, our measurement of the star’s brightness would not be exactly the same in every frame. These differences in brightness can be attributed to statistical variations in our measurements. For stars, we typically can model these variations with a normal, or gaussian, distribution. Several non-variable sources in the Galactic center, as identified by Witzel et al., are shown in figure 1. For Sgr A*, brightness measurements are not well fit by a gaussian distribution (with observational uncertainties), and thus the source is identified as variable.
Periodicity
Once a source is identified as variable, another important question comes to light: is the variability periodic? In the case of a SMBH, periodic variability could be attributed to “hot spots” in the accretion disk, as some researchers have suggested. Since the material in the accretion disk is orbiting the SMBH, the “hot spots” would appear brighter or dimmer at different points in the orbit. An orbiting gas clump, however, is not expected to have an extremely consistent brightness and period since it is subject to turbulence and other small scale effects. For this reason, researchers have looked for quasiperiodicity, which is more difficult to identify. Previous research has suggested the Sgr A*’s variability is quasiperiodic, but these studies only analyzed small subsets of the data now available. For this reason, Witzel et al. examine a data set comprised of many nights of observations.
So what does non-periodic variability look like? In the case of Sgr A*, some previous research has suggested that the overall variations in the light curve of Sgr A* can be explained by red noise (Press 1978). Red noise, or “flicker noise”, is random noise where the current observable depends on the previous one. That means the noise is not entirely random, and one is more likely to observe a source as bright if its last state was brighter than normal. In other words, red noise can explain the “flares” seen in Sgr A*’s light curve. Give enough data (i.e. statistically significant), the light curve of a source with variability characterized by red noise is well fit by a power law. This also means that flares of Sgr A* are observed on semi-predictable time scales — i.e. if we haven’t seen a flare in a while, we are more likely to see one. Otherwise, the distribution wouldn’t always be a power law.
Observations
Witzel et al. have examine 7 years of archival VLT data, which consists of about 11,000 individual useable frames. They performed aperture photometry to measure the brightness of Sgr A* in each image. Aperture photometry measures the brightness within a circle around a source. Witzel et al. used a small aperture around the location of Sgr A*, and then subtract an averaged background swatch to ensure the brightness is from the SMBH and not the sky background. The resultant light curve of Sgr A* can be seen in figure 2.

Figure 2: Witzel et al. figure 2. This figure shows the brightness of Sgr A* in all of the data sets used in this analysis with the time between the observations removed. The "flares", or extreme bright states of Sgr A* can be seen.
Results
Witzel et al. perform a statistical analysis on the brightness of Sgr A* over time. They find that the variability of Sgr A* is well fit by a pure power-law distribution at all brightnesses which have been observed. This finding indicates that variations in brightness of our SMBH’s accretion disk can be explained entirely by red noise, which is an important step in understanding the physics of Sgr A*’s variability and SMBH accretion disks in general.

