- Paper Title: Extragalactic number counts at 100 um, free from cosmic variance
- Authors: B. Sibthorpe, R. Ivison, R. J. Massey, I. G. Roseboom, P. van der Werf, B. C. Matthews, J. S. Greaves
- First Author’s Affiliation: Royal Observatory Edinburgh
Background
We know, from Einstein’s theory of general relativity, that space can take on any number of different geometries. We might rightfully wonder, then, what shape our own universe’s spacetime takes — is it flat and Euclidean, like the geometry we learn in grade school, or does it curve over large scales, like the surface of the earth? What did it look like when the universe was much younger — did it have a beginning? What will happen to it in the future?
Cosmologists attempt to answer these questions by taking measurements which should be sensitive to the specific shape of spacetime. Hubble’s discovery that objects have a redshift proportional to their distance is an example of such a measurement, and it allows us to infer that space is expanding. The much-celebrated result that this expansion is accelerating was discovered by measuring redshifts of extremely distant supernovae; in other words, even though we cannot observe spacetime directly, we can make inferences about it based on what we can see.
In fact, basic considerations and observations from the turn of the last century have led us to the conclusion that space is expanding, that it is expanding outward from an earlier, hotter, denser period known as the big bang, and that its shape can be described by a solution of the Einstein field equations known as the Friedmann–Lemaître–Robertson–Walker metric. Much like how the equation that describes a sphere can represent spheres of different sizes depending on the value assigned to its radius parameter, the FLRW metric has a number of free parameters which can be tuned to describe universes of different sizes, which are expanding or contracting, young or old. The goal of modern cosmology is to find the values for these parameters which then describe a model that most closely fits the universe we inhabit.
Another important consideration in general relativity is that spacetime cannot be described separately from the matter and energy it contains. This is why the discovery that the expansion of space is accelerating implies that it contains a sort of previously-unsuspected dark energy. The study of the shape of spacetime can tell us about its matter and energy content, and the study of the distribution of matter and energy can allow us to infer the properties of the space it occupies.
Cosmic Variance
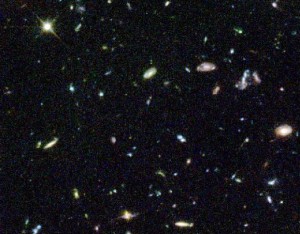
A portion of the Hubble Ultra Deep Field: an example of sampling distant, faint galaxies at a random point in the sky. Is this an accurate picture of the universe as a whole?
It should be clear that we cannot draw conclusions about the shape of the universe based on the observation of a single object, any more than we could characterize the population of country based on the nature and opinions of a single person. What we need are surveys of many objects throughout the universe, which then can statistically tell us something about the structure of the universe. Here, however, we run up against the problem of cosmic variance.
Suppose you were an alien who knew nothing of planet earth and just happened to stumble upon it one day. Odds are that you would happen upon a patch of the planet that is covered by water; and yet, if you concluded that the earth is covered by water, you would be wrong, and would miss out on the diversity of biomes, plants and animals that populate it. However, if you randomly sampled a hundred different points on the globe, you would start to assemble a picture that could tell you that the earth’s surface is submerged in water 70% of the time, that temperatures vary with latitude, and so on.
In much the same way, we risk a distorted view of the cosmos if we base our conclusions on a single, limited part of the sky. On the other hand, there is a direct trade-off between the size of the surveys we can mount, and the depth to which they can look back in time: since more distant (and younger) parts of the universe are dimmer, we need to take much longer exposures in order to see them. Telescope time is expensive though, and you could just as well spread the same amount of time over a wider portion of the sky to reduce the influence of cosmic variance.
The study described by this paper attempts to resolve these issues by sampling a number of smaller, deeper observations at random points in the sky. Specifically, what they’re measuring is the number of galaxies seen at these depths: the number count. The number count is sensitive to the geometry of the universe in that it depends on the number of galaxies in a given volume, and the shape of that volume can vary with the parameters of the FLRW metric. Number counts are already fairly well constrained by other, deeper surveys. This survey by Sibthorpe et al. (the Disc Emission via a Bias-free Reconnaissance in the Infrared/Submillimetre survey, or DEBRIS), using the Herschel Space Telescope, simply adds another few data points to this still-young field which have the critical ability to agree or disagree with past results.
Results
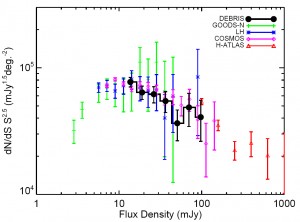
This plot shows the number count of galaxies as measured by the DEBRIS survey, and how it compares to previous results.
The number counts of galaxies measured in the survey are consistent with that found by other surveys (GOODS, COSMOS, and H-ATLAS, among others.) These are in turn consistent with predictions from the currently-accepted cosmological model.
The authors make an attempt to demonstrate that their survey is independent of cosmological variance, by measuring this variance across their sample directly. They do this by seeing how their number counts would change if their survey fields had been smaller.
By comparing the variation between number counts for samples of different angular size, we can tell if this survey has indeed accurately sampled the cosmos. The authors do this in figure 2 of the text.
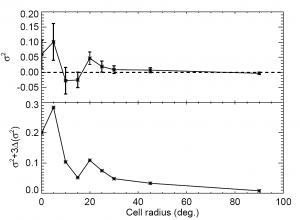
Variation between number counts as a function of the size of our counting region. You can see that as the size of the regions increase, their counts start to agree, and the variation between the regions approaches zero.
If the number counts depended heavily on where these samples were located in sky, as would be the case for strong cosmic variance across the survey sample, then counting the number of galaxies for each region would still give wildly different results. If, on the other hand, your number counts all start to agree as you approach the total size of the survey, then you can reasonably conclude that the survey has avoided being foiled by cosmic variance.
This is indeed what the data show. Of course, counting galaxies in smaller regions still can give answers that depend on where in the sky you’re looking, which we see on the left-hand side of figure 2; this is analogous to flipping a coin twice, getting two heads, and deciding that the odds of getting tails are 0%. As you flip the coin more— sample the cosmos over larger areas— your statistics will start to approach the real value of 50%.
In the final analysis, the authors hope to use the DEBRIS sample to get a better understanding of how to detect debris disks, which are disks of dust and material around stars like that which formed our own solar system. If you think you’ve found a debris disk around a star, there’s still a good chance that it might actually be a distant, faint galaxy behind the star. If we can get a good idea of how likely these distant galaxies are to impinge on nearby stars through cosmological surveys, then we can put stronger constraints on the odds that what we see is actually a debris disk.

