Title: Testing Diagnostics of Nuclear Activity and Star Formation in Galaxies at z>1
Authors: Jonathan Trump et al.
First Author’s Institution: University of California, Santa Cruz
Every massive nearby galaxy has a supermassive black hole in its center, just like the Milky Way has a black hole at the location of Sagittarius A*. We also know that the masses of these black holes are positively correlated with the masses of their host galaxies (specifically, the bulge); the more massive the galaxy, the more massive the central black hole. This evidence indicates that the evolution of black holes and galaxies is somehow connected (which has been discussed on astrobites before), but whether or not this connection is “causal” is still up for debate. In other words, we don’t know if the growth of a galaxy is responsible for the growth of its black hole (or vis versa) or if black hole and galaxy growth are simply modulated by some third parameter. One way to get a better handle on the problem is to understand the frequency of actively-growing black holes (also known as active galactic nuclei, or AGN) and the properties of their host galaxies, but finding all of the AGN can be pretty tough! In a paper recently accepted to the Astrophysical Journal Letters, Jonathan Trump and his co-authors use a combination of infrared spectroscopy and X-ray observations to investigate how successful some of the most popular AGN diagnostics are at high redshift, when both galaxies and black holes were more growing more rapidly than they are today.
One of the reasons this is so exciting is that it’s the first time this kind of spectroscopic study has been possible for more than a handful of high-redshift galaxies. What’s the big deal with spectroscopy? To quote a professor I once knew, “Pictures may be worth a thousand words, but spectra are worth a thousand pictures!” What she meant was that, although we can learn a lot from looking at pictures of objects in space (like how bright it is or its shape), the additional information we gain by looking at how much light comes out at different wavelengths is what really lets us do astrophysics. Of course, some of the same science can be done if you have many photometric measurements and can construct a spectral energy distribution (SED), which is essentially a very low-resolution spectrum. A lot of astronomy today is done by studying SEDs, especially because spectroscopy generally takes so much more time than photometry, but since you’ll never be able to measure individual spectral lines from SEDs, spectroscopic observations are still the gold-standard in many fields.

Figure 1: An example of the BPT diagram. The blue points represent star-forming galaxies, whereas the red points indicate AGN. The "composite" objects in grey have intermediate line emission ratios between AGN activity and star formation, but their actual nature is still unclear.
Of particular interest to our discussion of galaxies and AGN is the diagnostic tool called the BPT or Baldwin diagram, named after the authors of a landmark 1981 paper by Baldwin, Phillips, and Terlevich (see Figure 1, taken from this astrobite). The BPT diagram and similar diagnostics are able to determine whether an AGN or star formation is providing most of the energetic photons in a galaxy by comparing the flux from closely separated optical emission lines. The “harder” ionizing spectrum from an AGN, which has more photons coming out at very high energies, will increase the flux from “forbidden” lines (like [NII] or [OIII]) relative to hydrogen recombination lines (like H-alpha or H-beta), but two ratios must be used in order to break the degeneracy between an inactive low-metallicity galaxy and an AGN (both of which will have, for example, a high ratio of [OIII] to H-beta). The most famous line ratios, and the ones used in the classic BPT diagram, are [OIII]/H-beta and [NII]/H-alpha, but these lines are redshifted from the optical into the infrared by z~0.4.

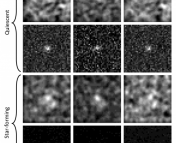
Figure 2:Examples of spectra from HST (top) and MOSFIRE (bottom), showing fits to the continuum (red) and optical emission lines (blue and green).
Unfortunately, ground-based infrared spectroscopy has historically been pretty inefficient, making large studies of high-redshift galaxies extremely difficult. Luckily, the field has been changing with the development of new instruments like the MOSFIRE spectrograph on the 10-meter Keck I telescope in Hawaii. MOSFIRE, which stands for Multi-Object Spectrometer for InfraRed Exploration, was commissioned this spring and represents a ~100x increase in efficiency over the other near-infrared spectrograph at Keck (NIRSPEC). This gain is possible because the detector in MOSFIRE is much more sensitive than those installed in previous-generation infrared instruments, and because MOSFIRE can observe up to 46 separate objects at once using a configurable slit unit that can be changed on the fly. In addition to MOSFIRE, there are exciting new infrared spectrographs planned for other facilities too (e.g., FIRE), and together they will revolutionize our understanding of the high-redshift Universe by providing us with an opportunity to see whether locally calibrated relations, like the BPT diagram, also apply for distant galaxies.
In a first step toward this important goal, the authors use H-band spectra from MOSFIRE (covering [NII] and H-alpha) together with G141 grism (slitless) spectra from the Hubble Space Telescope (covering [OIII] and H-beta) to measure the emission line ratios for 36 galaxies at a redshift of ~1.5, when the Universe was only 30% its current age (see Figure 2). To determine whether the emission line diagnostics are successful at separating AGN activity from star formation, they use X-ray observations as an independent probe of nuclear activity for four of their galaxies, and find that their classification from emission line ratios is consistent with the X-ray classification. In addition, the fact that X-ray AGN are found in the composite region of the BPT diagram implies that these composite objects do, in fact, contain actively-accreting supermassive black holes, which has not been previously confirmed. Together, AGN and composite objects make up ~66% of their sample, which is much higher than the local value of ~15%.
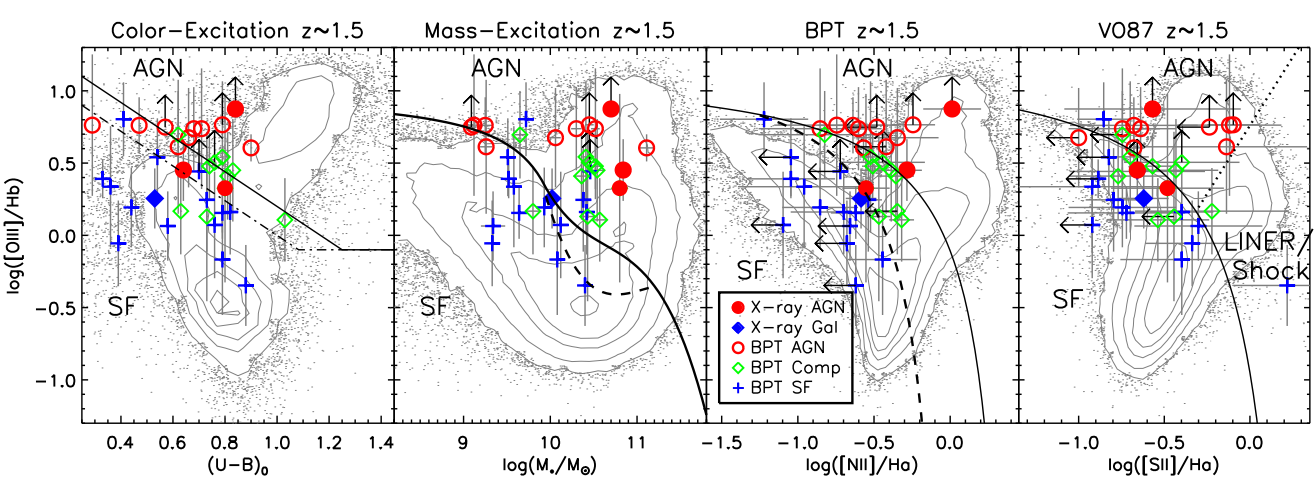
Finally, the authors compare the BPT diagram with other diagnostics, also calibrated at low redshift, that use rest-frame U-B color and stellar mass instead of [NII]/H-alpha (see Figure 3) and find mixed results. The mass-excitation method (second panel) does a reasonable job separating AGN from star-forming galaxies, but the color-excitation method (first panel) identifies only 7 of the 12 AGN found using X-ray observations or emission line ratios.
This paper comes at the beginning of an exciting new time for extragalactic science, since it is now possible to study the physical properties of many galaxies at high-redshift. But it also provides a cautionary tale, since it appears that at least some local diagnostic tools will need to be recalibrated in order to use them to study distant galaxies. As more galaxies are observed using new infrared instruments like MOSFIRE, it is likely that we will continue to see many more results like these, including more detailed studies of the AGN fraction at high redshift.

Allison,
Thank you for your article. I have been working with Varoujan Gorgian at Caltech on a research paper looking at AGN in the .9>z<1.2 range and using color selection of surrounding galaxies to discover new clusters. We now have time on Keck for early spring to confirm our findings. Perhaps we should have MOSFIRE collect data on the AGN to detemine characteristics which might be common to these cluster candidates? Are you presenting any posters in Long Beach? I will be there. By the way this is all part of the NITARP program sponsored originally by Spitzer Science Center.
Regarding your question about using MOSFIRE to follow up your targets, I think that’s a question better put to your collaborator. Either way, though, I wish you the best of luck with your observations.
I myself am not presenting at the AAS in Long Beach, but many of the astrobites authors will be there, so keep a look out for them!