TITLE: Comparing the Ancient Star Formation Histories of the Magellanic Clouds
AUTHORS: Daniel R. Weisz, Andrew E. Dolphin, Evan D. Skillman, Jon Holtzman, Julianne J. Dalcanton, Andrew A. Cole, Kyle Neary
AUTHORS’ INSTITUTION: University of Washington
The evolution of galaxies can be investigated in two ways: we can observe galaxies at farther distances to get a picture of how galaxies appeared at earlier times (since the light from these distance sources requires time to reach our telescopes), or we can study the remnants of past events in our nearby universe. This paper is an example of the latter approach. Using archival data from the Hubble Space Telescope, the authors try to piece together the detailed history of how the Large and Small Magellanic Clouds formed their stars.
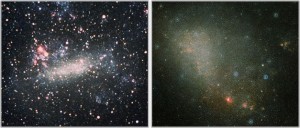
The Large Magellanic Cloud and Small Magellanic Cloud (LMC and SMC) are two of the closest neighbors to our home galaxy, the Milky Way. In fact, they’re so close that they’re classified as satellite galaxies, meaning they’re gravitationally bound to the Milky Way in the same way the Earth is gravitationally bound to the Sun. They’re also rather smaller, less-thoroughly formed, and irregularly shaped than our own galaxy, being examples of dwarf galaxies. If you want to study populations of stars and how they form, it’s hard to find better subjects than the Magellanic clouds; they’re close enough that we can make out the individual stars (especially with a telescope with Hubble’s resolution) and they’ve been extensively investigated over the years, giving us a solid understanding of their sizes and distances and other properties.
The stars that make up the LMC and SMC were formed over a period of many billions of years. If we could get a picture of when the Magellanic clouds formed their stars (their star formation histories, or SFH), this would tell us in turn about their histories in a larger context: if they’ve been whizzing around the Milky Way and brushing up against it or each other, then this would be reflected in their star formation histories. On the other hand, if they formed their stars out in an emptier part of the universe and were only recently captured by the Milky Way, then we would expect their star formation histories to be similar to other such galaxies we observe. So how can we reconstruct their star formation histories?
The Main Sequence
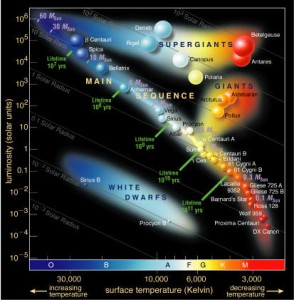
A plot of luminosity versus color for various stars, commonly called a Hertzsprung–Russell diagram. The main sequence is the prominent, diagonal feature in the middle. All ordinary, newborn stars start their life on this main sequence.
When a cloud of gas and dust, collapsing under its own gravitational attraction, reaches a high enough density, it will begin to have nuclear reactions in its core and become a new star. At this point, the cloud stops collapsing, and its gravitational contraction is balanced by the energy released in its nuclear reactions. The initial mass of the collapsing cloud will determine the eventual star’s brightness and color, which will be tightly related to one another. In other words, a new-born star can’t have just any combination of color and brightness, and instead will fall somewhere on the acceptable range called the main sequence.
In fact, if we plot of the brightness and color of a large population of stars (in what’s known as a Hertzsprung-Russell diagram,) we can see this main sequence of stars. All ordinary stars start their life as main sequence stars, but after they consume their hydrogen fuel they will move off the main sequence, becoming white dwarfs or red giants. The massive stars (bright and blue) eat up their fuel the fastest and are the first to go, which means that you can tell the age of a population of stars by seeing how complete its main sequence is: an older population will have had enough time to start losing redder and redder stars, which peel off the main sequence to become giants.
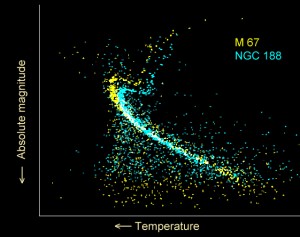
Another example of a Hertzsprung-Russell diagram, now showing stellar populations from the clusters M67 in yellow, and NGC 188 in blue.
So, provided we have detailed pictures of the LMC and SMC, we can pick out stars, measure their colors and brightnesses, and construct their Hertzsprung-Russell diagrams. Then, armed with theoretical models of how stars are formed and evolve, we can create a great many model H-R diagrams, each representing populations of stars with different star formation histories, and see which one best fits the LMC and SMC.
Findings
This paper is part of an ongoing study, meaning these are just some of the interesting preliminary results. The LMC and SMC are so close, and Hubble’s data is of such high resolution, that the authors have to perform this analysis for little pieces of each Magellanic cloud at a time. This paper presents results from 15 such pieces, but their final analysis intends to use over 100.
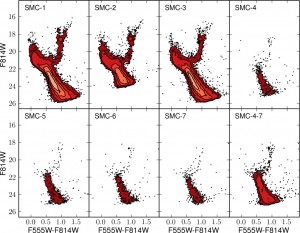
H-R diagrams for seven different parts of the Small Magellanic Cloud, clearly showing main sequences and main sequence turn-offs, indicating ages. From Figure 2 in the text.
In the image to the right, you can see H-R diagrams (color-luminosity plots) for the seven fields selected in the Small Magellanic Cloud. The prominent, central feature represents the main sequence for these fields, and the little branch coming off of it to the right shows where stars are leaving the main sequence to become giants, after living long enough to exhaust their fuel.In general, this study is deeper (finding fainter stars) than the ones that came before it, while also being the first to apply the same, consistent analysis for both the SMC and LMC simultaneously.
The business of extracting star formation histories from these plots is accomplished by software called MATCH, which matches plots like these to computer-generated models created from stellar evolution models. Figure 5 in the text (below, left) shows the results for this analysis, for the combined fields in both the LMC (blue) and SMC (red). Essentially, this plot shows the rate at which stars had to appear on the main sequence and at what times for the final H-R diagram to look the way it does today. Different star formation histories would create different-looking star populations (different amounts of young and old stars and red giants), and MATCH finds the likeliest history by comparing all possibilities to the data.
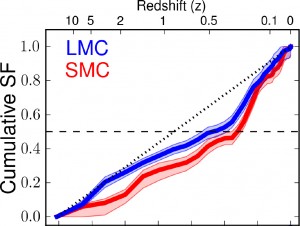
The cumulative star formation history of the Large and Small Magellanic Clouds, from Figure 5 in the text. It shows the fraction of the total stars in each galaxy that was present at earlier times (higher redshifts.) At the present day (redshift 0) both galaxies have formed all of their stars, giving a cumulative star formation fraction of 100% (1).
This plot shows the cumulative star formation, meaning what total fraction of the present-day stars had been formed at each moment in the past. The sharp rise at the right of the figure indicates that a large fraction of the stars in both the LMC and SMC have been formed as recently as 3.5 billion years ago, while the clouds themselves have been around for 13 billion years at least. Presumably, this star formation burst occurred when these galaxies swung in close to the Milky Way, getting distorted and shook up by its gravitational influence. Since we don’t see similar peaks in the past, this supports the notion that the LMC and SMC have been recently captured, and haven’t been orbiting the Milky Way for most of their lifetime.
There are other interesting results one can pull from this data, by seeing how the population of stars changes between dense and sparse parts of each galaxy, or looking for evidence of interaction between the LMC and SMC in the past. However, all of this will be improved by considering a larger portion of both Magellanic clouds. This preliminary paper demonstrates the capability of this analysis, but it will be most interesting to see the final results of the completed study.

There is what I presume to be a typo in your third figure: M67 and NGC 188 are OPEN CLUSTERS in the Milky Way…..
Right you are- I’ve fixed it. Thanks!