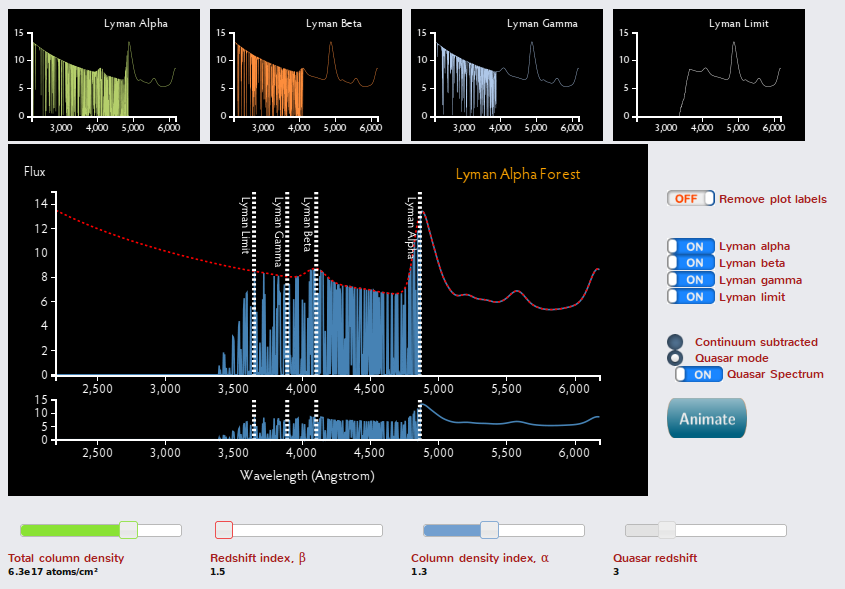
An example of an astro-interactive: Yuan-Sen Ting’s online interactive software simulating the Lyman Alpha forest.
Recently on Astrobites, we’ve discussed interactive astronomy software created by graduate students at Harvard University illustrating astronomy concepts. Now we offer you a chance to help us design new interactive software!
Astrobites is embarking on a new experiment we’re calling Astro-interactives. For an inspiring example of the educational potential of these interactive visualizations, read Andrew Pontzen’s recent Astrobite featuring an interactive exploration of the meaning of inflation in cosmology.
We’re looking for interesting, important, and under-appreciated ideas in astronomy to explicate using new interactive visualizations. We invite Astrobites readers to send us your ideas (even your recent publications!) for datasets, theoretical models, or simple simulations that should be explored via the following google-form. Your pitch could be for a concept you never quite understood, a concept you struggle to explain to others, or a concept that you have a unique way to explain beautifully – all ideas are welcome.
Please submit your pitch using this Google form before Monday, November 11th.
We will choose a few exciting ideas and pass them on to Astrobites’ resident guest interactive visualization expert, Yuan-Sen Ting, to expand them into an Astrobite and develop interactive plots. For examples of his past work, see Yuan-Sen’s interactive software on the Lyman-alpha forest and stellar absorption line formation (recently covered on Astrobites).
For example, the following are some ideas that can be implemented with these available technologies. Feel free to turn these ideas into more detailed pitches!
- Solutions of the Friedmann-Robertson-Walker metric for different cosmological parameters
- Explaining K-corrections for galaxy photometry at different redshift.
- Visualizing the astrometric, photometric, and radial velocity signature of an exoplanet in different orbital configurations
We are looking forward to hearing your ideas and working with you!
Author
I model X-ray emission from the solar wind interacting with the Earth’s magnetosphere and neutral gas in the outer (Really far out) atmosphere. It would be cool to see an animation of the boundary of the magnetosphere compressing/expanding, the intensity of X-ray emission that occurs outside that boundary, and the line of sight of an X-ray space telescope (Chandra) through the emission region/magnetosphere as its orbits Earth. All the information you need can be made available: time-dependent 3D solar wind density and magnetosphere boundary, X-ray emissivity, and Chandra orbital position and look direction.