If you’ve spent time around the astronomical literature, you’ve probably heard at least one term that made you wonder “why did astronomers do that?” G-type stars, early/late type galaxies, magnitudes, population I/II stars, sodium “D” lines, and the various types of supernovae are all members of the large, proud family of astronomy terms that are seemingly backwards, unrelated to the underlying physics, or annoyingly complicated. While it may seem surprising now, the origins of these terms were logical at the time of their creation. Today, let’s look at the history of a couple of these terms, to figure out why astronomers did that.
Stellar Spectral Types
All stars have assigned spectral types. From the hottest to coldest, these types are O, B, A, F, G, K, M, L, T, and Y; our sun is on the hotter end of the G spectral type. It looks like there might be some order here: B and A are next to each other, as are F and G. Then why is O way over on the hot end?
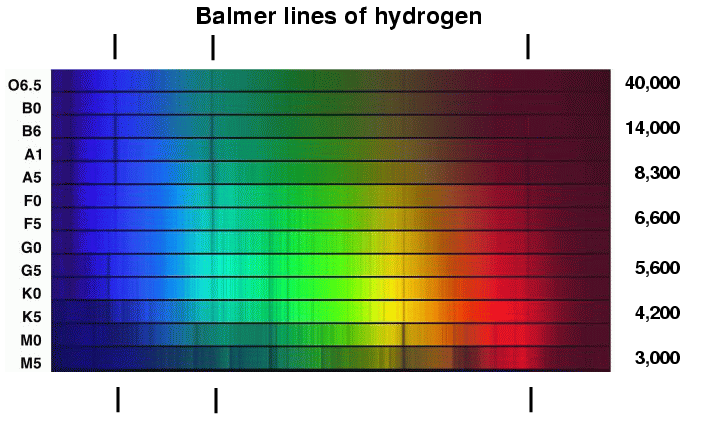
These spectral types have their origins in the late 19th century. In 1877, Edward Charles Pickering assembled a team of women to analyze astronomical data, a story that Ann Druyan, Neil DeGrasse Tyson, and the rest of the Cosmos team recently discussed. [Go read that article. No, really. I’ll wait.] One of these women, Williamina Fleming, classified the vast majority of these stars based on the depth of the hydrogen absorption lines observed in the stellar atmospheres. A stars had the deepest lines, while M, N, and O stars had essentially no lines. An entirely reasonable system, based off the observational data at hand.

Hydrogen absorption lines (marked) in visible light. A stars have the deepest lines, while the hydrogen lines of M dwarfs are barely visible. Image from RIT Physics.
Unfortunately, physics got in the way. These lines form in the presence of hydrogen transitions to the n=2 excited state. Hydrogen at this energy level is in abundance for A stars, but photons escaping from hotter O stars have so much energy they excite these atoms immediately, while M dwarf photons have so little energy they excite hydrogen to these higher levels very rarely. As a result, these lines are very strong at intermediate stellar temperatures. This was worked out by Antonia Maury and Annie Jump Cannon from 1897 to 1901; the latter of these two was the one to rearrange and reduce Fleming’s system into the now-familiar seven letters. With the discovery of the first brown dwarfs in the 1990s, the L, T, and Y spectral types have been added, again, in decreasing temperature.
Magnitudes
The traditional measure of brightness in astronomy is the magnitude. The magnitude is a logarithmic scale, like the Richter or decibel scales. Unlike these scales, however, it is normalized such that a factor of 100 increase in flux corresponds to a change of five magnitudes. Oh, and it’s backwards: the fainter an astrophysical object, the larger its magnitude. With our modern understanding of photons and radiative flux, this system falls somewhere between annoying and nonsensical. Yet in its beginnings, there is reason! For these origins, we have to visit ancient Greece and the astronomer Hipparchus, who we find in the second century BCE. In addition to being one of the first dynamicists (dude was the first to measure the eccentricity of Earth’s orbit and the precession of the equinoxes, and calculated the length of the year to within six minutes), Hipparchus developed a catalog of stellar positions and brightnesses, creating the field of astrometry. (The astrometric Hipparcos mission of the 1990s was named after him). He gave numbers to each star corresponding to the brightness he observed, from 1 to 6. Each step was designed to correspond to an equal decrease in brightness.
The eye wasn’t well-understood at the time, but we now know the eye is a logarithmic tool. This was proven in the 19th century by Ernst Heinrich Weber and Gustav Theodor Fechner. The former proved that a small observed change in measured brightness is a function of the brightness ratio between two sources (mathematically, that for two sources A and B, δm = A/B). The latter turned Weber’s findings into a scale that relates the true magnitude of a stimulus to its perceived intensity, showing the relation to be logarithmic.
With the knowledge of the Weber-Fechner laws, it is clear to us that Hipparchus’ magnitudes correspond to a logarithmic system in flux. Unfortunately, these laws weren’t fully understood for 2000 years after the beginnings of this system. As a result, the magnitudes stuck. The system was refined in the 19th century: without any instruments more sophisticated than his eyes, Hipparchus’ original definitions were fairly arbitrary. In 1856, Oxford’s Norman Pogson proposed defining the magnitude such that five magnitudes of difference corresponded to a factor of 100 difference in flux. As a consequence, one magnitude corresponded to a factor of approximately 2.5 in flux; this is the system still in use today.
Have a favorite astronomy quirk that I missed? Curious about some unit? Want to share a cool historic naming convention story? (One of my personal favorites is the origin of the calcium “H” and “K” lines.) Let us know in the comments, and your suggestions could feature in a follow-up article!


What I’d like to know is why so much creativity goes into naming stars and planets but almost no effort goes into naming things like the big red spot, the very dark spot or the Very large array.