Title: Most 1.6 Earth-radius planets are not rocky
Author: Leslie A. Rogers
Author’s Institution: Caltech
Status: Submitted to ApJ
Whenever a new small or low-mass exoplanet is discovered, the internet gets plastered with images like this:
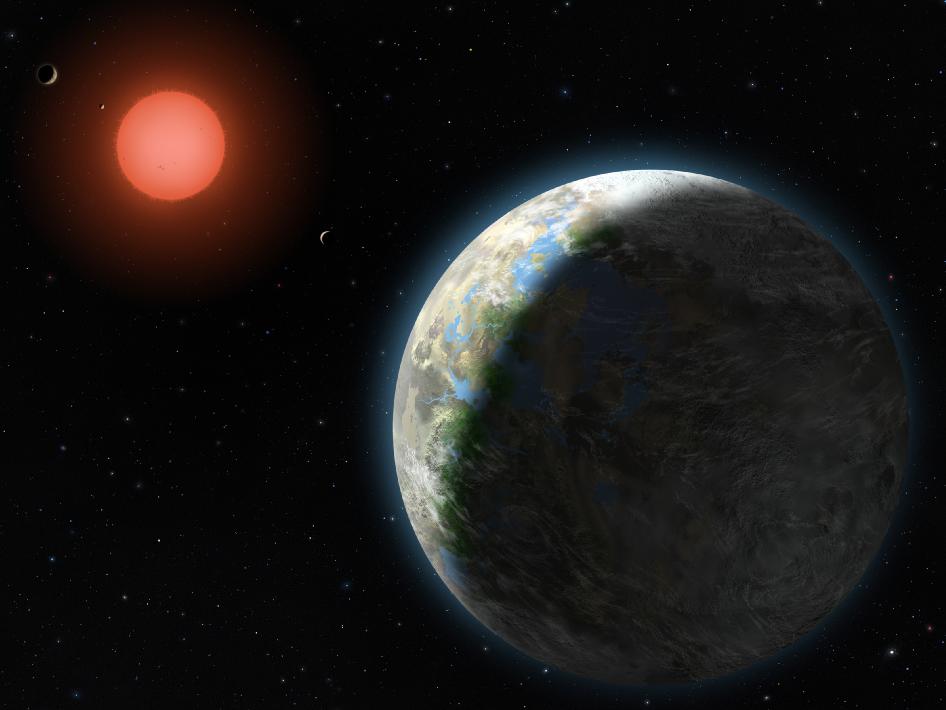
An artist’s impression of Gliese 581 g. Image credit: Lynette Cook
But these romanticised artistic impressions of exo-Earths and super-Earths with oceans and continents are totally misleading—in reality we know very little about what these planets look like. For most small planets all we know is their radius and the length of their year. We don’t know what they’re made of, what their atmospheres are like, whether they have clouds, or whether they have a rocky surface at all.
For a few planets (plotted in figure 1) we know their radius AND their mass. These planets are transiting—they pass between their host star and the Earth once every orbital revolution, blocking out a fraction of starlight. We can measure the radii of transiting planets, relative to their host star’s radius, from the decrease in brightness as the planet transits. Some of these planets orbit stars that are bright enough for us to measure their mass. We can detect the ‘wobble’ of the host star caused by gravitational tugs from its planet and measure planetary mass from the amplitude of the wobble. For the few planets with both radii and masses we can calculate their density.
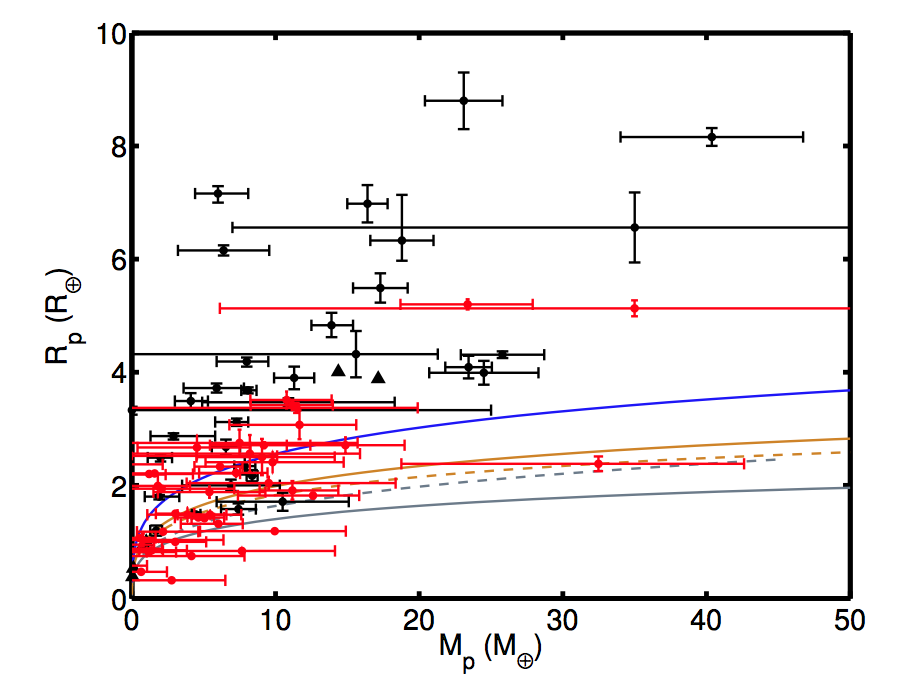
Figure 1. All planets with mass and radius measurements. The red points are the Kepler planets used in this paper. The black points are other planets not used here. The triangles are the Solar system planets. The blue line shows the mass-radius relation for a planet made entirely of ice, the brown line is for pure silicate, the dashed brown is an Earth-like composition, the dashed grey is the maximum theoretical density of an exoplanet and the solid grey is for solid iron. A rocky planet would lie near the brown lines – for example, the red point with ~ 2.5 Rearth and ~32 Mearth is probably rocky.
Planet composition
What does density tell you about a planet, other than whether or not it would float in the bath? Well, it tells you what the planet is made of, on average. Theoretical models can be used to calculate the radius of a planet, for a given mass and composition. A planet made entirely of silicates and iron—a ‘rocky, Earth-like planet’ will have a much smaller radius for the same mass than a planet made entirely of hydrogen and helium or a planet made entirely of water and ice. There is some degeneracy of course: planets made of half rock and half gas could have the same radius for a given mass as a planet made entirely of water and ice. Figure 1 shows exoplanet mass-radius relations for various compositions.
In our own Solar system, small planets (Mercury, Mars, Venus and Earth, in order of ascending size) are rocky and large planets (Neptune, Uranes, Saturn and Jupiter) are not rocky. Somewhere between Earth-sized planets and Neptune-sized planets lies the transition from rocky to not rocky. We have to look at other planetary systems to pin point exactly where that transition takes place.
The questions asked in this paper are: what fraction of planets are sufficiently dense to be rocky, as a function of radius? Is there a sharp transition from rocky to not rocky and where does it fall? For each planet in their sample, Rogers et al. calculate the probability that it is rocky (see figure 2).
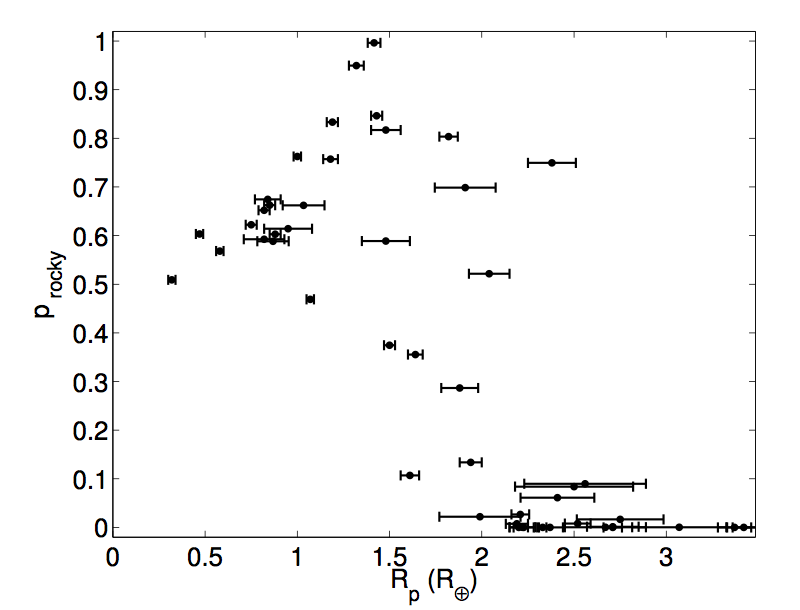
Figure 2. The probability that a planet is rocky, as a function of radius. Between 1.5 and 2 Earth-radii there is a transition from planets most likely being rocky to most likely being not rocky.
Hierarchical Bayesian inference
This paper throws the Bayesian book at this problem. The authors use hierarchical Bayesian inference to constrain the population of planets.
Rogers et al. have some data: a set of light curves and radial velocity measurements for each planet. They have a set of parameters that characterise the individual planets, e.g. planet mass and radius, which they can infer from that data. They also have another set of parameters that describe the population of exoplanets (which is what they’re truly interested in) which can be inferred from the resulting masses and radii.
Bayesians always use probability distributions to describe parameters. They allow intuition to enter their modelling process via a choice of prior probability distribution, which reflects their prior belief in the parameter values. For example, you wouldn’t expect to find a planet more dense than lead—theory just doesn’t allow it, and you can build that into your modelling process with a prior. Now here’s the clever hierarchical bit. The priors on the individual planet masses and radii depend on the values of the population parameters. Why is that? Well, if the population parameters tell you that it is unlikely for a planet to have, say, a very low mass and a very large radius, then you can build that into your prior and suppress the probability in that region of parameter space. Rogers et al. infer the values of all the parameters at the same time: individual planet parameters and population parameters. The population parameters feed back into the individual planet parameters, which feed into the population parameters, etc, and that’s what makes this process hierarchical.
The above process is not the only awesome statistical method used in this paper. They also properly account for the large uncertainties on their data using a fancy sampling technique, but I’ll leave the interested reader to check out the paper themselves for the details.

Figure 3. The posterior PDF of the position of the rocky-not rocky transition. The median value is 1.48 Earth-radii.
Model comparison
Rogers et al. use a step function to model the planet distribution: i.e. below a certain radius all planets are rocky and above that radius they are not rocky. The transition radius is a free parameter (the only parameter of this model). They also try a couple of other models – one in which there is a smooth transition from rocky to not rocky, and one in which the rocky/not rocky threshold depends on the flux received by the planet from its host star. They compute the Bayesian evidence, or the ‘fully marginalised likelihood’, which is the likelihood of the data integrated over all possible values of the model parameters. The evidence tells you how likely your choice of model is, given your data, and penalises more complex models. Rogers et al. find that the evidence is highest for the simple step model. That doesn’t mean that there isn’t some gradual transition between rocky and not rocky in reality mind you, just that this particular data set doesn’t favour that model.
Results
Rogers et al. explore the posterior probability distribution of the single parameter in their simple step function model: the position of the transition from rocky to not rocky. The posterior, shown in figure 3 has a median value of 1.48 Earth radii. Using results from the second model, the one with the smooth transition, the authors answer the question ‘at which radius are most planets sufficiently dense to be rocky’? The answer: 1.6. Above this radius less than 50% of the planets are not dense enough to be rocky.
So next time you see a pretty picture of a super-Earth with a rocky surface, ask whether its radius is bigger than 1.6 Earths. If so, it’s probably wrong!
Author
Trackbacks/Pingbacks