- Title: Observation of small-scale anisotropy in the arrival direction distribution of TeV cosmic rays with HAWC
- Authors: Abeysekara et al., the HAWC collaboration.
- First author’s institution: Department of Physics & Astronomy, Michigan State University, USA & Department of Physics and Astronomy, University of Utah, USA.
- Status: submitted to the Astrophysical Journal.
The Earth is constantly reached by highly energetic nuclei from our Galaxy and beyond that we call “cosmic rays”. When these nuclei, mostly protons, interact with our atmosphere, they produce showers of particles that can be detected by balloon experiments or by experiments on the ground. The origin of these cosmic rays is not well understood. They span such a large range of energies (from 108 eV to 1020 eV, roughly), that it is hard to think that they could have a common origin. The lower energy cosmic rays (below ~ 1017eV) are thought to arise from the remnants of supernova explosions, while the more energetic ones are suspected to come from active galactic nuclei, gamma-ray bursts and quasars in other galaxies.
In general, it is hard to pin point the direction of the sky from which the cosmic ray is coming. The typical distance (or gyroradius) that a cosmic ray can travel before changing its direction due to inhomogeneities in the magnetic field of our Galaxy is 1 light-day. Any source of cosmic rays that we can think of (like supernova remnants) are much farther away. For example, the Vela supernova remnant is 800 light years away. Hence, the initial direction of the cosmic rays should be washed out before they reach us. However, scientists are puzzled: several experiments have reported an excess of TeV (1012 eV) cosmic rays coming from certain directions in the sky.
The High-Altitude Water Cherenkov Observatory (HAWC) is an experiment under construction near Sierra Negra, Mexico. It is originally built for the purpose of detecting gamma-rays. However, highly energetic cosmic rays are also detected by the experiment. When a cosmic ray reaches the atmosphere, its shower of secondary particles produces Cherenkov light when they traverse HAWC’s water tanks, and it is this light that is detected. With this information, the direction of the cosmic ray can be inferred to within 1.2 degrees. On the one hand, Cherenkov light from cosmic ray showers are a nuisance to the gamma-ray observations that are the main aim of HAWC, but it also constitutes an interesting measurement on its own. After roughly one year of gathering data, HAWC has measured variations in the cosmic ray intensity across the sky at the level of 0.0001.

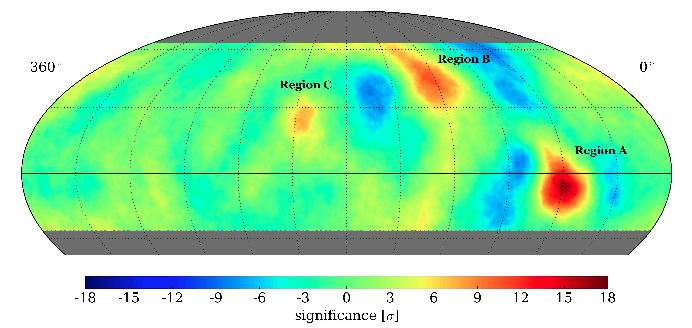
Figure 1. The TeV cosmic ray sky as seen by HAWC. Large scale variations (on scales > 60 degrees), which are sensitive to incomplete sky coverage, have been subtracted from this map. The three excess regions are identified in the map, and these coincide with those found previously by other experiments. Figure 5 of Abeysekara et al.
The HAWC team has found an excess of cosmic rays coming from three different regions of the sky, as shown in Figure 1 above. All of these regions had previously been identified by other experiments (the Milagro experiment and ARGO-YBJ), and one of these regions is now detected more clearly in the HAWC data, confirming the previous results. The colors in the map indicate the significance level: a comparison of the level of detection of each feature to the noise in the measurement. The authors also explore the energy spectrum of the cosmic rays coming from Region A, the most significant region detected, and they find them to be more energetic than those that come from the whole sky, on average.
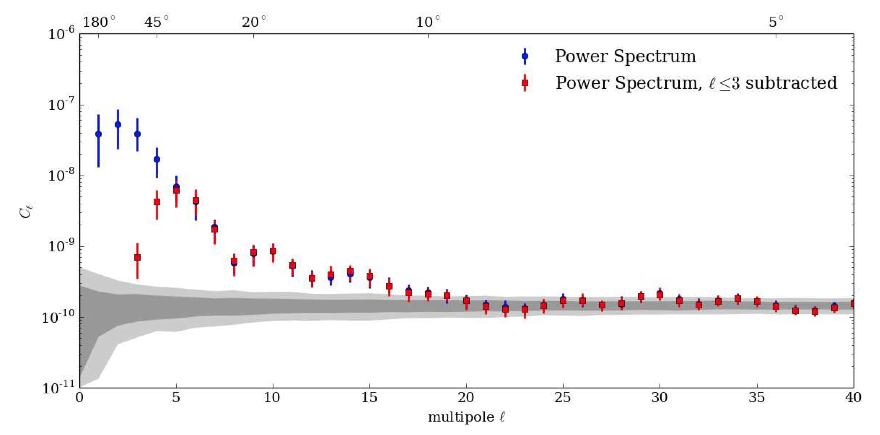
The team has also computed the power spectrum of the cosmic ray intensity. This is a function that tells us the relative abundance of intensity variations of a given scale in the map (commonly used in cosmology), and it is shown below in Figure 2. The blue points give the power spectrum of the whole map, while the red points correspond to a version of the map where the largest scale variations have been subtracted. The gray bands indicate the expected result if the cosmic rays came from random directions in the sky. Both the detection of the three excess regions and the structure in this plot can help elucidate the structure of the magnetic field in the neighborhood of the Earth, the physics of how cosmic rays propagate throughout the interstellar medium and the locations of Galactic sources of cosmic rays.

Figure 2. Power spectrum of cosmic ray intensity map from the HAWC measurements. The blue points correspond to the power spectrum of the map of the whole sky, while for the red points, the largest scales variations have been subtracted. The authors are most interested in the red power spectrum in this work, which shows variations in the intensity of cosmic rays across the sky on scales smaller than 60 degrees. Figure 8 of the Abeysekara et al.


Hi Elisa…. let me see if I understand correctly. This paper deals with the issue of where rays come from, as the authors find the areas in the sky where there is an excess of cosmic rays. Therefore, as you say, the paper makes a contribution on the locations of Galactic sources of cosmic rays…. However, due to the changes in the direction of rays throughout the space, the concentration in certain areas says very little about where they may be coming from…. Am I correct?? Thanks… your articles are so interesting!!!