- Title: MIARMA: An information preserving method for filling gaps in time series (Application to CoRoT light curves)
- Authors: J. Pascual-Granado, R. Garrido, J. C Suárez
- First Author’s Institution: Instituto de Astrofísica de Andalucía – CSIC, 18008, Granada, Spain
- Paper Status: Submitted to A&A
“Music is the silence between the notes.” – Claude Debussy
Astronomical data gathered over time has gaps. For instance, when using a ground-based telescope, there is the pesky fact that roughly half of every 24-hour period is lit by the Sun. Or, the star you want to look at isn’t above the horizon, or clouds are blocking it. Even the most reliable space telescopes suffer from occasional pauses in their otherwise constant watchfulness.
Why are gaps a problem? Can’t astronomers just analyze the short chunks of data that don’t have gaps? Besides, no observation is truly continuous: there is always some gap between data points. Why should slightly longer or shorter gaps really make a difference?
The answer: Fourier transforms.
The Fourier transform “is like a mathematical prism—you feed in a wave and it spits out the ingredients of that wave.” (Read more of the superb Nautilus piece explaining the Fourier transform here.) It is an incredibly versatile data analysis tool. But in order for it to work perfectly, there are a couple important rules. First, the starting wave, or dataset, can have no beginning or end. Second, all the data points must be evenly spaced.
Of course, those of us leftward-of-mathematician on the field purity scale know that gap-free, infinite observations are never going to happen. So we need to fill gaps and mask edges. Today’s paper takes a look at how this is often done (spoiler: not carefully enough), and proposes a new gap-filling method to better preserve all the information in stellar light curves.
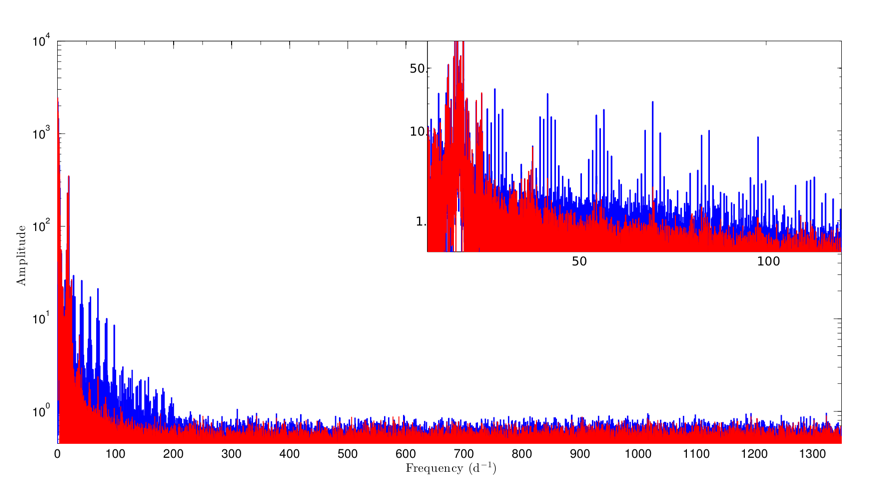
Periodogram (calculated using a Fast Fourier Transform) of a Delta Scuti star’s pulsations. The blue version has gaps in the light curve filled with simple linear interpolation, while the red version has used Pascual-Granada et al.’s new MIARMA algorithm to fill the gaps. Figure 1 from the paper.
The image above compares two slightly different Fourier transforms of a pulsating Delta Scuti star light curve, observed by the CoRoT satellite. The blue transform uses a common gap-filling technique: linear interpolation. This is simply drawing a straight line from the last point before a gap to the first point after it and pretending points on that line are observations with the same regular spacing as the real data. In contrast, the red transform uses a new algorithm called MIARMA to fill gaps in the light curve. As you can see, the frequencies and their heights and patterns are very different between these two methods. Since the main goal of asteroseismology is to learn about the insides of stars by studying their oscillation frequencies, you had better be sure you are studying the correct frequencies!
Pascual-Granada et al. create the MIARMA algorithm using an autoregressive moving average (ARMA) model. In essence, it looks at data on either side of a gap to predict what happens after the gap ends and before it begins—an autoregression, and it does this many times for each gap with different combinations of data points—a moving average.
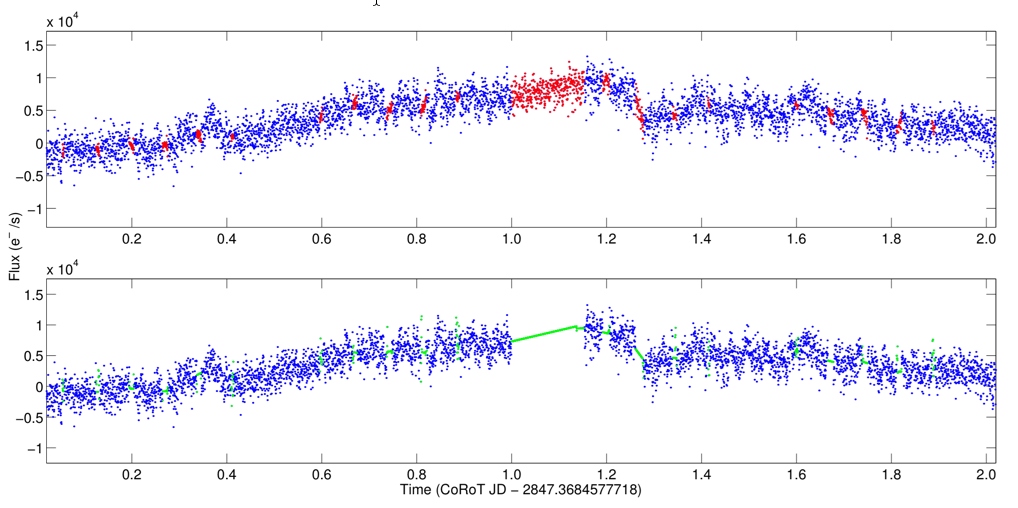
Filling gaps in a solar-type star’s light curve spanning two days. Blue points are CoRoT observations, red points are gaps filled with MIARMA, and green points are gaps filled with linear interpolation. Figure 6 from the paper.
To demonstrate MIARMA preserves information better than linear interpolation, the authors test it on three different variable stars observed with CoRoT. They study the Delta Scuti pulsator described above, a Be star with longer time variations, and a rapidly-varying solar-type star.
Overall, MIARMA makes the biggest difference for the two stars with light curves that vary more slowly. For these, frequency spikes present in the linear interpolation case match with how often gaps tend to occur. The MIARMA Fourier transform lacks these telltale spikes and is free of aliasing—a common problem in signal processing in which incorrect frequencies and amplitudes are inferred because you aren’t recording data often enough. But the choice of gap-filler does not matter as much for more rapidly-varying solar-type stars. This makes sense because the typical separation between two gaps is long compared to how quickly the star is varying. As a result, the scientifically interesting frequencies are less susceptible to being affected by the gaps.
The authors report that their new method will be used to process all CoRoT data going forward, and can be adapted to work with Kepler data too. This is an important reminder that scientists must deeply understand their data. Sometimes the most problematic data points are none at all.
Author
I like Debussy’s quote. Thanks for featuring our algorithm.