Title: New NIR light-curve templates for classical Cepheids
Authors: L. Inno et al.
Institution of First Author: Department of Physics, University of Rome Tor Vergata
The Cosmic Distance Ladder
Distance is a tricky thing to measure in astronomy. We can’t use tape measures or rulers, and even more sophisticated methods like laser ranging are only good for the very nearest of neighbors, like the moon. To figure out how far away other astrophysical objects are, astronomers use the cosmic distance ladder. The cosmic distance ladder starts with objects that are close enough for us to get direct measures on their distance (usually though parallax) and then uses those fundamental distances to calibrate the distance farther out. Each successive measurement of distance from a new phenomena builds upon the measurements before it, hence the name. One type of distance indicator we use are standard candles (there are ‘standard rulers’ as well, but those are less common). Standard candles have a known intrinsic luminosity, so we can determine their distances from how bright we observe them to be.
Henrietta Swan Leavitt
Cepheids, which have been previously been mentioned in several astrobites, are stars that vary in magnitude in a periodic fashion. Cepheid luminosities are proportional to the lengths of their periods, something known as the period-luminosity relation (first discovered by the brilliant Henrietta Leavitt while she was working as a human “computer” at the Harvard College Observatory), which makes them good standard candles. Since an object’s brightness depends on its distance from us, we can generally only measure intrinsic luminosities if we know how far away it is. With Cepheids, however, we can measure their periods to determine their intrinsic luminosities, and from there determine their distances. They are also especially important because they are one of the first “rungs” in the cosmic distance ladder.
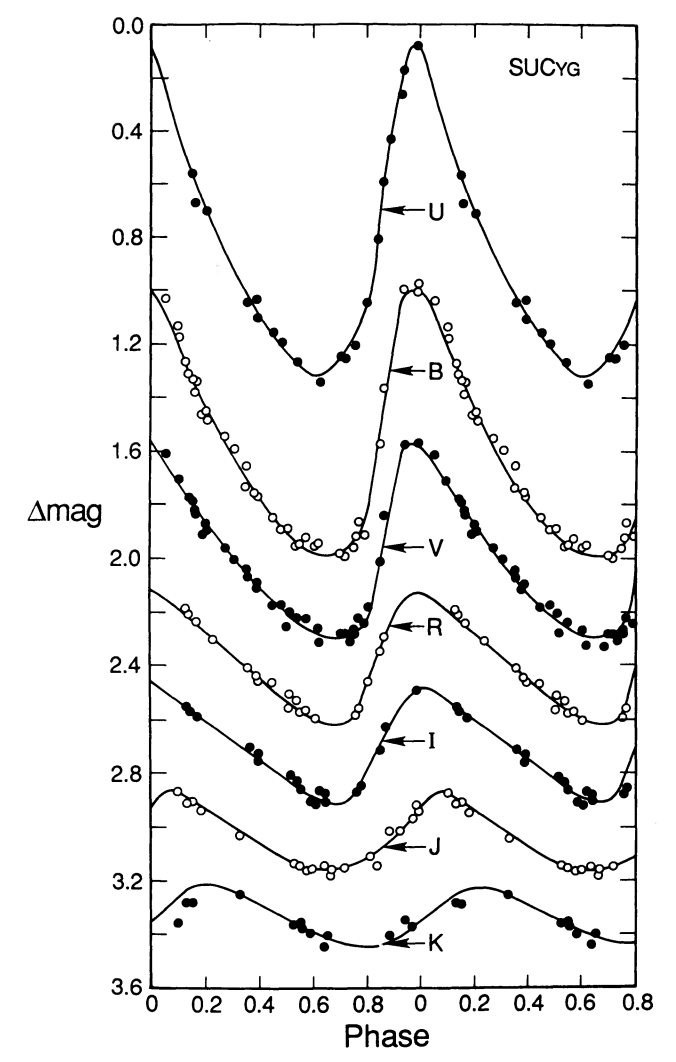
Figure 1: This is figure 5 from Madore & Freedman 1991. It shows the variations in the amplitude and the phase at which the Cepheid reaches maximum light across many different bands. The top light curves are at ultraviolet and optical wavelengths, and the bottom few in red and near-infrared, out to 2.2 microns for the K band. Note the distinctive ‘sawtooth’ shape in the shorter wavelengths, which becomes more sinusoidal at longer wavelengths.
Characterizing Cepheids
Measuring the mean magnitude or period of a Cepheid, however, can be a pretty demanding task in its own right. A Cepheid’s light curve looks different in different wavelengths (as shown in Figure 1, taken from Madore and Freedman 1991). The shorter-wavelength bands like the B and V-bands have light curves with larger amplitudes of variation and more asymmetry than the light curves in longer-wavelength near-infrared bands like J, H, and K. This makes it easier to detect and characterize the Cepheids in the B and V bands, but harder to accurately determine the mean magnitude of a Cepheid in those wavelengths, since we have to know accurately what phase of the light curve we are observing in order to get a good measurement of the mean magnitude. In practice, we often want to use measure the periods using light curves from shorter wavelengths and measure the mean magnitudes using light curves from longer wavelengths.
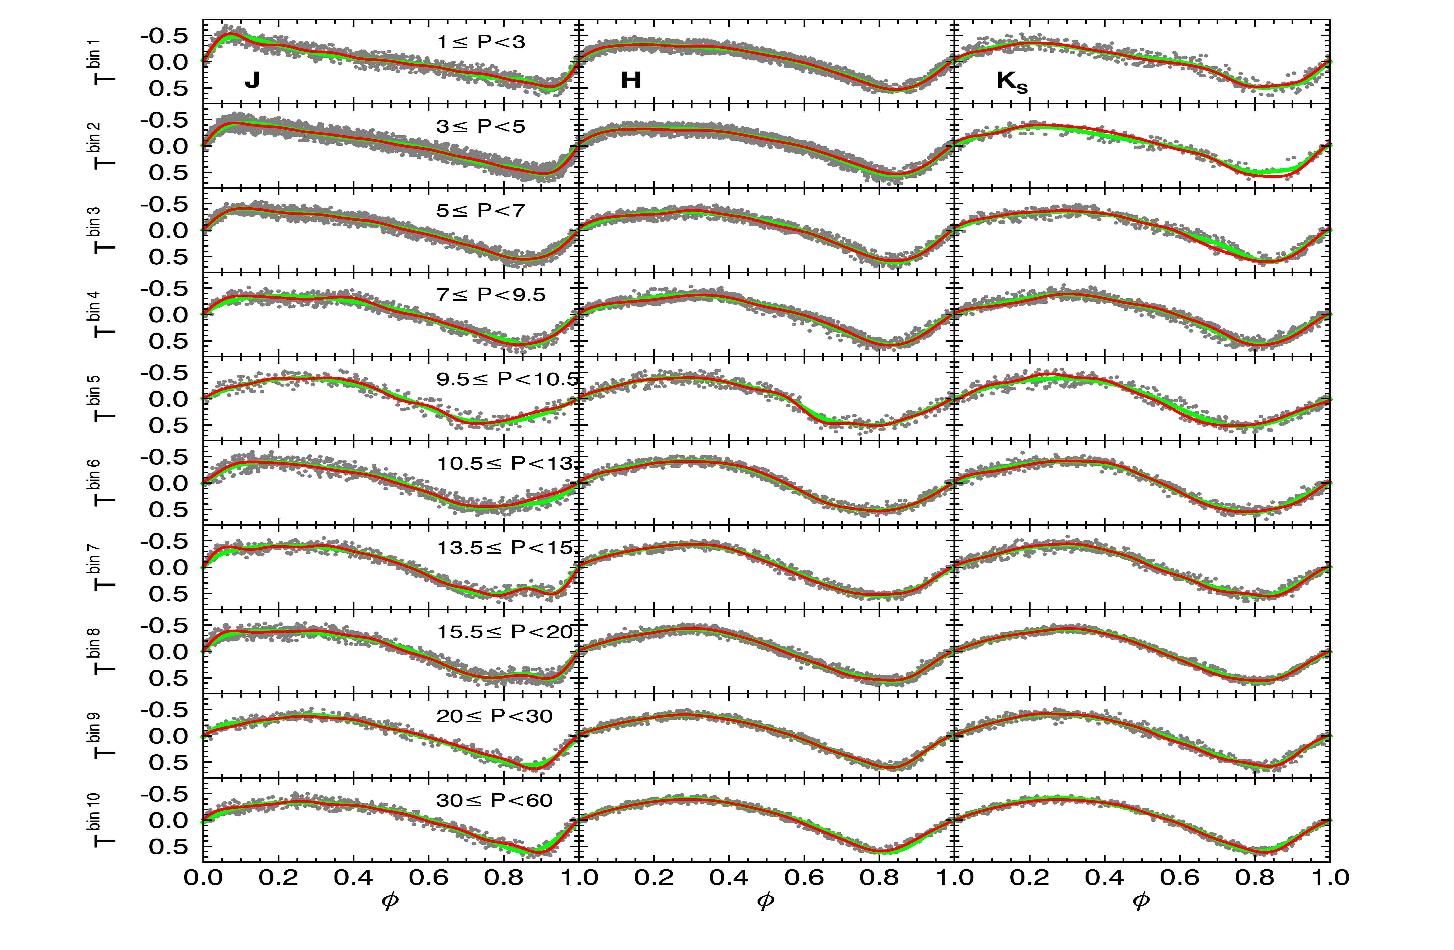
Figure 1: Figure 4 from the paper, showing the merged Cepheid light curves and templates in ten period bins for fundamental mode Cepheids (Cepheids that pulse without any stationary radial ‘nodes’). The P refers to the range in period in days and J, H, and K are three wavelength bands, with K, the longest, at 2.2 microns. The green line indicates the multi Gaussian templates and the red line the Fourier series templates.
Near infrared (NIR) observations, however, are costlier than optical observations because it is more difficult to remove the background sky from NIR observations and because the camera technology is not as advanced in the infrared as it is in the optical. As a result, we have fewer observations of Cepheids in those wavelengths. This is where light curve templates can help us. We’ve already mentioned that a there’s a relationship between a Cepheid’s period and luminosity, but the shape of a Cepheid light curve is also related to its period. By putting together observations of many Cepheids, we can create template light curves that accurately predict the shape of a Cepheid’s light curve for a given period and in a given wavelength. Then, using the templates, we can get an estimate of a Cepheid’s mean magnitude in the NIR with just one observation.
New NIR Light Curve Templates
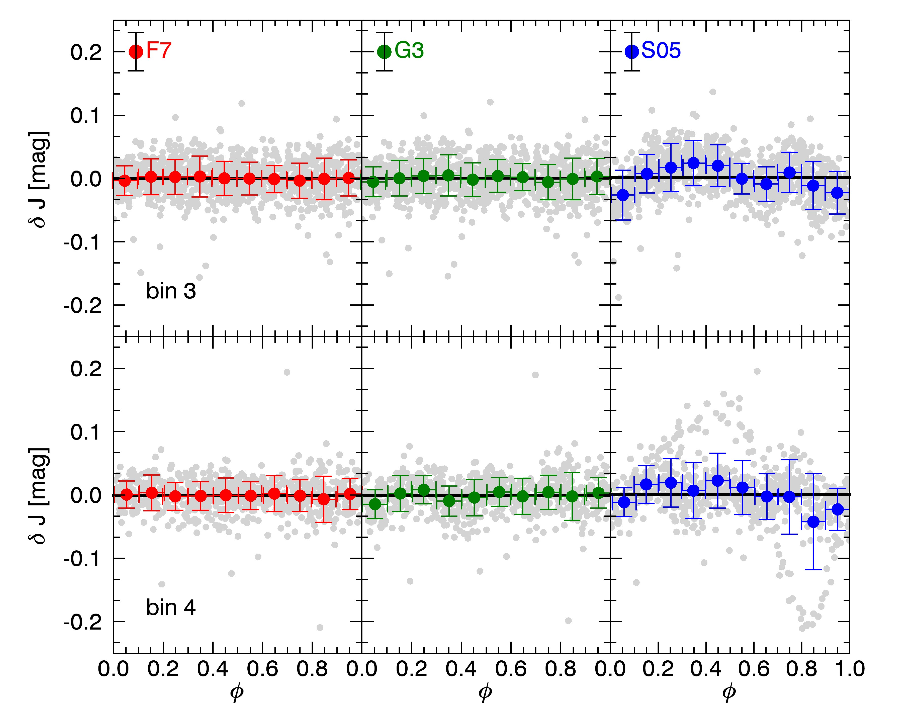
Figure 3: Figure 11 from the paper, which shows the improvements in the residuals of their templates (red and green) over older NIR templates (blue). Delta J is the difference in the J-band between the true mean magnitude and the and the mean magnitude computed using the J-band templates and a single mock observation. The red and green indicate the different fit functions they used for their templates while the blue points are residuals from a set of NIR templates from 2005. The bin numbers just indicate the period duration they tested. The red and green points have a mean of zero (less than 0.001 mag) and uncorrelated residuals, whereas the blue points have a mean of about 0.001 mag and suffer from non-symmetric, phase-dependent residuals not present in the former two.
The authors of today’s paper have created new NIR Cepheid light curve templates that can be used in helping us measure the magnitudes, and thus, distances to Cepheids much more accurately. The templates cover a wide range of periods – from 1 to 100 days – and are based on a sample of 200 Cepheids (over 3 times the number used previously in making NIR templates).
Traditionally, the periods have been measured from the maximum of one period to the maximum of the next, but this can introduce significant errors for Cepheids whose light curves look like they have double or flatter peaks (a result of the Hertzsprung Progression) because it is difficult to determine exactly when they are at maximum light. The authors of today’s paper take a different approach: they make use of the ‘sawtooth’ shape of the light curves (as seen in Figure 2), where the brightness of the star increases rapidly. Using this steep rise to anchor the period is more accurate than using the peak. This method also allowed the authors of today’s paper to eliminate the phase-dependent residuals present in previous templates. Finally, in addition to fitting the light curves with (a more commonly-used) seventh-order Fourier series, the authors also tried fits using multiple period Gaussians. The period Gaussian functions allow them to get good fits with fewer parameters (from 15 to 9) and to be less sensitive to spurious features in the data.
Upon applying their NIR templates to a single NIR observation, the authors are able to provide mean magnitudes that are 80% more accurate than a mean magnitude estimated from just one data point. This brings the average error in magnitude to less than 0.02 mag. This error is less than the intrinsic scatter of the period-luminosity relation, so it means that these templates allow the mean magnitude of a Cepheid to be measured to the precision limit with just one NIR observation. The results of this paper will bring us closer than ever to accurate determinations of distance.
Author
Great presentation!