- Title: 3D printing meets computational astrophysics: deciphering the structure of η Carinae’s inner colliding winds
- Authors: T. I. Madura, N. Clementel, T. R. Gull, C. J. H. Kruip, J.-P. Paardekooper
- First Author’s Institution: Astrophysics Science Division, Code 667, NASA Goddard Space Flight Center, Greenbelt, MD 20771, USA
- Paper Status: Accepted for publication in MNRAS
A new dimension
In a sense, our view of the Universe is two dimensional. We are relatively confined to our cosmic location, and can only observe the passage of minuscule spans of time compared to the timescales of most cosmic processes. As we look out into space, we see light from stars and galaxies as a 2D sheet stretched over the inside of a giant spherical shell, and are to unable spin around a supernova remnant to view it at different angles or click fast forward to view the entirety of a galactic merger event. Modern technology has helped to alleviate this constrained view, as computer simulations allow astronomers to view these events as more than a static picture on the sky and gain knowledge of how they evolve in time. Today’s paper utilizes computational astrophysics to examine a time-dependent event, but also incorporates another technological advance into their research arsenal. The authors brought a new dimension to their results by including 3D interactive features into their journal publication and creating the first 3D prints of an astrophysical supercomputer simulation’s output. From rocket engines to replacement human organs, applications of 3D printing have offered enormous potential for technological advance, and as this paper shows, can also lead to new discoveries in astrophysics.
Eta Carinae – A big fan of stellar winds
Eta Carinae is a poster-child of stellar explosions. In the 1840s, this massive binary star system produced the biggest non-terminal stellar explosion ever recorded, which made it the second brightest object in the non-solar-system sky and later produced the famous Homunculus nebula. Though its light has dimmed since then, its attention in the astrophysical community has certainly not. Massive stellar binaries such as Eta Carinae are relatively rare in our galaxy, and the interaction of these behemoths is a test bed for interesting physics.
Because they are so luminous, both stars have powerful radiation-driven stellar winds. In fact, the more luminous primary component of the system (ηA) has one of the densest known stellar winds, whereas the less luminous member (ηB) has extremely fast winds that are believed to fly at a swift 3000 km/s. The authors explored the region where the stellar winds of the two stars collided and interacted, known as the wind-wind interface region (WWIR). This violent collisional interface results in strong X-ray emission but is tough to model; with a short period of ~5.5 years and high eccentricity of ~0.9, the orbital motion of the system greatly affects the geometry and dynamics of this region. Smoothed particle hydrodynamic (SPH) simulations were used to model the colliding winds, which performs hydrodynamics by using many smeared-out interacting particles.
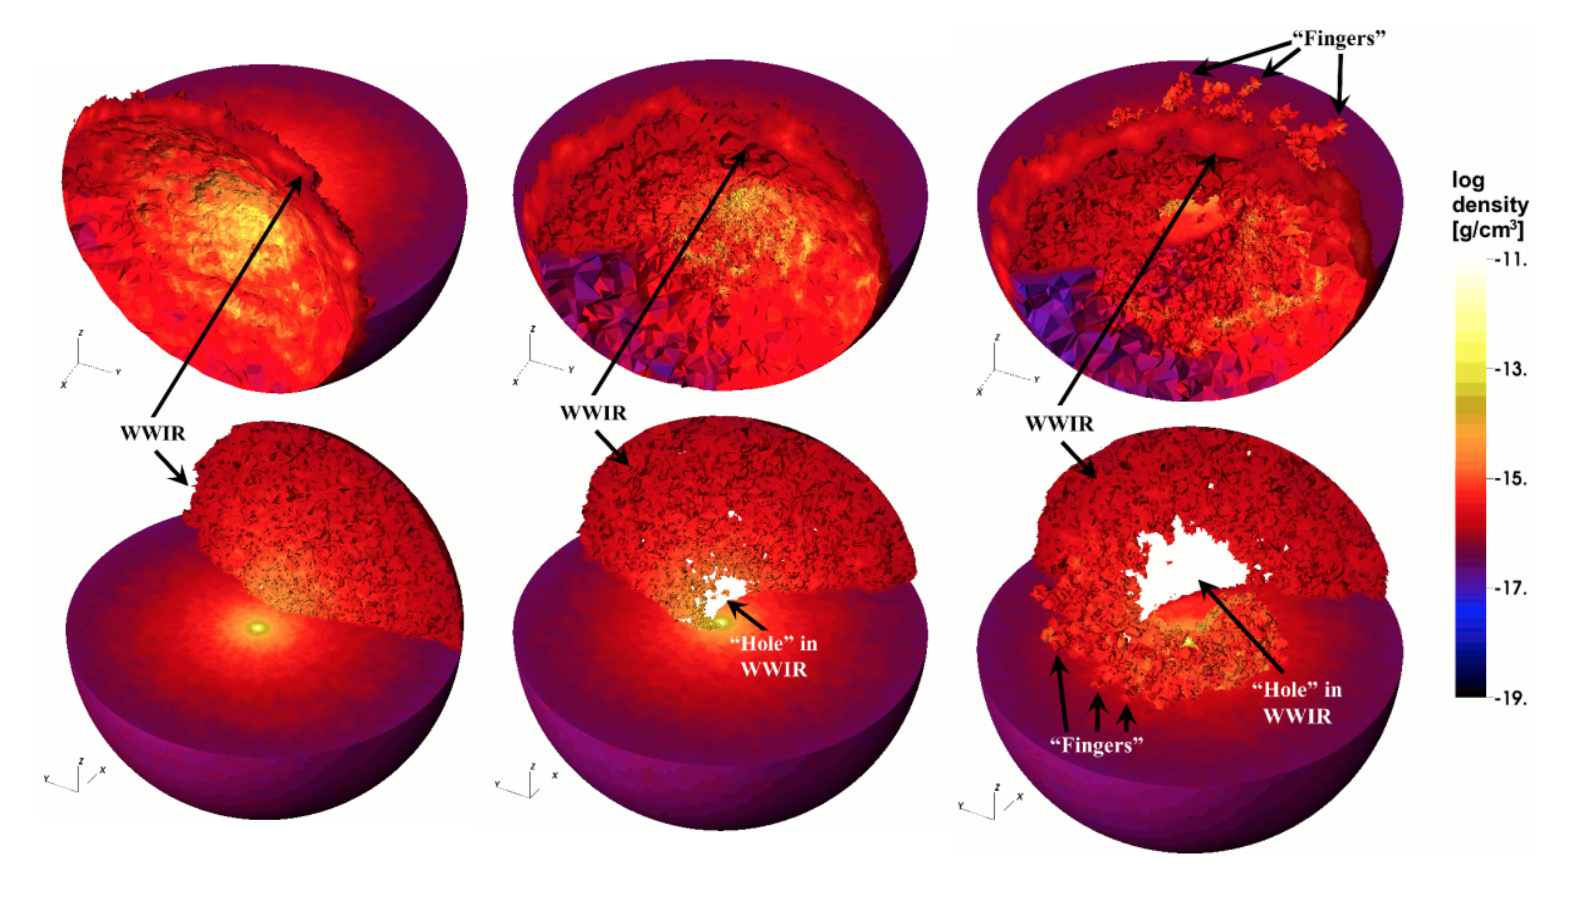
Figure 1 – 3D view of Eta Carinae’s WWIR at apastron (left column), periastron (middle column), and 3 months after periastron (right column) from SPH simulations. For each orbital position, the top and bottom rows show different spatial orientations (rotated 180 degrees on the z-axis). The images show a top-down view of the orbital plane, and also include the 3D surface of the WWIR that exists above the orbital plane. Color represents the density of the wind. The stars are scaled up in size, and key features are labelled. Credit: Figures 1-3 in Madura et. al 2015.
3D visualizations of the simulation were created for 3 specific phases of the orbit: apastron (furthest orbital separation), periastron (closest orbital separation), and 3 months after periastron. Figure 1 shows 2D slices of the wind-wind interface at these three orbital positions, but if you have Adobe Acrobat Reader, you can see the real deal 3D representation. Though the interface region at apastron (figure 1, left column) is by far the “cleanest”, it is still riddled with protrusions due to Kelvin-Helmholtz and non-linear thin shell instabilities (instabilities that arise from a thin wind being bound by shocks on both sides). The visualizations at periastron (figure 1, middle column) and 3 months post-periastron (figure 1, right column) are far more complicated, but also far more intriguing, and uncovered features that were unnoticed by previous studies using 2D visualizations. One feature is a clear “hole” in the trailing arm of the WWIR. The authors believe that this is due to the high eccentricity of the orbit; when ηB‘s orbital dance brings it closest to the massive ηA, it becomes embedded in ηA‘s dense wind and its own wind is forced out in a confined direction. Figure 2 shows the cavity being blown out in the WWIR by mapping the wind speed and density for a small space around the stars in the simulation (this can be seen much clearer by the interactive video, which can be found in the paper). The complex post-periastron geometry contained another surprising new feature uncovered by 3D analysis – protruding tubes in the WWIR of ηB‘s hot wind encased in thin shells of ηA‘s dense wind (see figure 1, right column). About 2 dozen of these “fingers” were produced in the WWIR, and projected out several AU. The study suggested that the fingers are results of instabilities in the colliding winds such as thin-shell or Rayleigh-Taylor instabilities, though if the fingers are in fact real not even Hubble’s sharp eyes would be able to spatially resolve them.
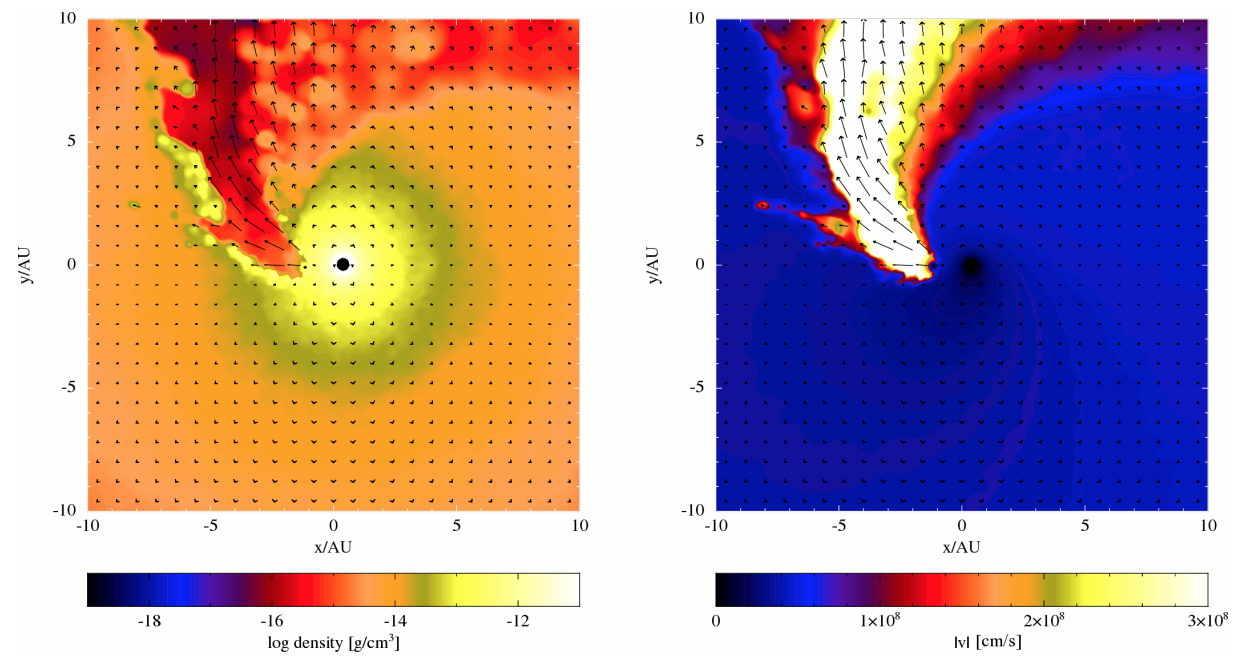
Figure 2. The density (left) and speed (right) of the stellar winds at periastron. The wind velocity vectors are overlaid on both plots to show the magnitude and direction of the wind. The length of the arrows is proportional to the magnitude of the wind speed. To better see the evolution of the wind, see the short movie embedded in the paper. Credit: Figure 7 in Madura et al. 2015.
Holding a star in your hands
3D-prints have been made of astrophysical objects before (even of Eta Carinae), but all have been rendered based on observations and not simulations. This study created the first 3D models from the output of simulations, which allowed even better examination of the system’s detailed geometry and its variations over time. Though the intricacies of the models led to a broken finger (not a human finger, thankfully), it was nothing that a little glue couldn’t remedy. Figure 3 shows one of the 3D prints of Eta Carinae’s WWIR.
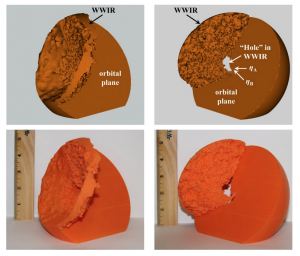
Figure 3. 3D rendering and 3D printed model of the WWIR at periastron. 1 inch corresponds to ~35.5 AU. Credit: Figure 9 in Madura et. al 2015.
This paper stresses the importance of incorporating 3D interactive figures into PDF journal publications, and the benefits of using 3D visualizations and models to best understand complex, time-dependent astrophysical phenomena. 2D figures are dominant in the literature because of the need to display 3D data in a classic paper-journal format, but now that most astronomical journals are available online this need is becoming obsolete. Though still in its nascent stages, 3D printing in astronomy offers a new and interactive way of communicating complex cosmic systems to the public, and even offers a medium to better describe the wonders of astronomy to the blind and visually impaired. Maybe one day soon a subscription to the Astrophysical Journal will come equipped with a pair of 3D glasses.
Author
This is so cool! How accurate are these models? Do you think 3D print modeling will take off? It seems like a cool novelty, but do you think researchers will learn anything new from printing models in this way?
Hi Emily, sorry for the late response! The models should be spot-on with the simulations, though like normal 2D printing, 3D printing is also resolution limited. By this I mean that there are only a certain number of “dots” that the 3D printer can make per cubic inch, just like a normal printer can have only draw a certain number of pixels per square inch. As far as the accuracy of the simulations, those largely depends on the conditions that are set for the things being modeled, which are determined through observations and our knowledge of the physics of what’s going on in these environments. For this simulation, things like wind speed, wind density, and orbital parameters of the two stars play important roles.
As for your second question, I think that looking at simulations in 3D and putting 3D-interactives into papers will lead to new discoveries and realizations of these complex astrophysical systems. They are able to show a lot more of what’s going on than 2D cuts of 3D simulations. In this study, the authors were able to uncover new things by rendering their simulations in 3D. As for now, I think the 3D prints themselves have best potential as outreach tools – to help show people what these simulations are telling us and better describe how scientists do research, but as the technology matures I’m sure it will play an important role in research as well.
What a cool application of 3D printing technology! I wonder how popular 3D printing will get given how advanced computer visualizations have become.
I do to! It’s exciting to follow new technology in its nascent stages, and especially with the wide variety of applications in many different fields I’m sure the 3D printing will evolve quite quick.
Is there a limit to the precision of these 3D prints? I didn’t know 3D printing had become so finely detailed.
Hi George. Just like normal 2D printing, 3D printing is resolution limited. The numbers I googled say that the best 3D printers to date can create layers that are 16 micrometers thick, which means they can put about 1600 dots per inch. This is about 4 billion dots per cubic inch!
I think the use of new technology is going to enhance how much information can be communicated in a paper, especially where data visualization is key. Do you think such tools might be used to make scholarly articles more accessible to people outside of the field or even the general public?
I defintely think that this innovation will help to better communicate science to the public. Even for professionals in the field, the “money plots” are often considered the most important part of the paper as they best illustrate what the accomplishment of the study was. In a similar way, I think the use of 3D interactives will give the general public a better way of accessing the information of the paper without having to decipher the complicated text.
Was the explosion in the 1840s from the binary system a result of its intense stellar winds or was it something else? Could it be the first beginnings of an eventual supernovae death?
The stars of Eta Carinae are certainly on their way towards a type II (core-collapse) supernova. As far as I know, what caused the great eruption of the 1840s is still somewhat of an unsolved mystery, but the intense stellar winds from these stars were blowing long before the explosion.
That’s so cool! As said, I couldn’t imagine 3D printing was already so advanced!