July 5-8 a few other Astrobiters and I attended the Extreme Precision Radial Velocities (EPRV) workshop held at Yale University. This astrobite summarizes the main takeaway points from the workshop.
The radial velocity technique to detect exoplanets involves detecting the stellar wobble motion caused by orbiting exoplanets. To do this, we use spectrographs to take repeated spectra of the star to sample the stellar motion (or wobble) of the star. Is the star moving away from us (redshift), or towards us (blueshift)? To set things in perspective, the Earth exerts about a 10cm/s wobble on the Sun. The pace of a strolling tortoise. Our most precise spectrographs are able to detect signals down to the 1m/s level. Normal human walking speed.
We are, as of now, not precise enough to detect Earth analogs.
How do we achieve 10cm/s precision? Can we do that in the next decade? These are big questions—the key questions of the workshop. A group of 150 leading research scientists and tech company representatives came together to discuss the answers to these questions. There were numerous talks, parallel breakout sessions and posters. Below follows a summary of the sessions I attended.
The path towards 10cm/s
In the opening talks, Andreas Quirrenbach, Andrew Szentgyorgyi, and Suvrath Mahadevan noted that the challenges to 10cm/s radial velocity precision is a fight against a long list of error-terms—some of which are understood better than others—all of which add together to degrade the overall precision of a radial velocity measurement. “We need the right tools to hammer them [the error terms] down,” said Debra Fischer. We have advanced since the last EPRV meeting in 2010, but it is clear that more work lies ahead.
The challenges towards achieving 10cm/s can be divided into three main areas: instrumentation, statistics, and understanding of photospheric signals. From there, each area can be subdivided into finer, more concrete challenges.
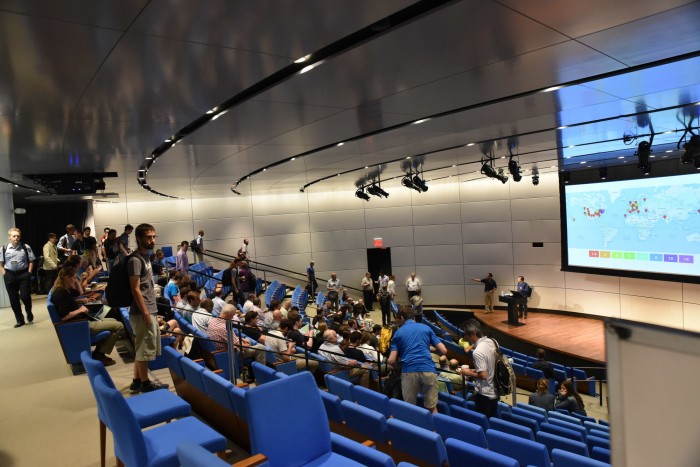
Fig 2: The workshop brought together 150 leading research scientists and tech company representatives.
Instrumentation
Hardware is hard. Many details need to be taken into account in the design of spectrographs. Additionally, spectrographs need to be calibrated in order to get accurate wavelength information from stellar spectra.
High precision spectrographs are usually echelle spectrographs. They tend to be higher in resolution, and offer better signal-to-noise ratios over other spectrograph designs. Echelle spectrographs come in two main flavors by how they are calibrated: HARPS-like and HIRES-like. The former is named after ESO’s High Accuracy Radial velocity Planet Searcher (HARPS) spectrograph which uses a simultaneous calibration feed to track instrumental drifts. The latter is called after the HIgh Resolution Echelle Spectrometer (HIRES) at the Keck telescope, which uses an iodine cell for calibration. Francesco Pepe noted in his breakout session that HIRES-like spectrographs are in principle more precise, but in practice they require an order of magnitude more photons to achieve the same signal-to-noise ratio. Next generation spectrographs are generally designed to be HARPS-like.
We have seen tremendous technological advances in calibration methods. From least expensive to most expensive, the most popular calibration methods for HARPS-like instruments are: emission line lamps (e.g. Th/Ar), stabilized Fabry-Pérot etalons, and Laser Frequency Combs (LFCs). Emission lamps are cheap and have a long heritage in many observatories, but their spectra are not evenly illuminated. In his talk, Ansgar Reiners talked about Fabry-Pérot etalons, which offer a broad, evenly illuminated spectrum for a moderate price, but need to be externally stabilized. Scott Diddams, David Phillips, and Tilo Steinmetz all presented intriguing work on Laser Frequency Combs, which have progressed rapidly in recent years, and are now becoming commercialized. LFCs are still the most expensive choice, but are very attractive for the precision and stability that they offer.
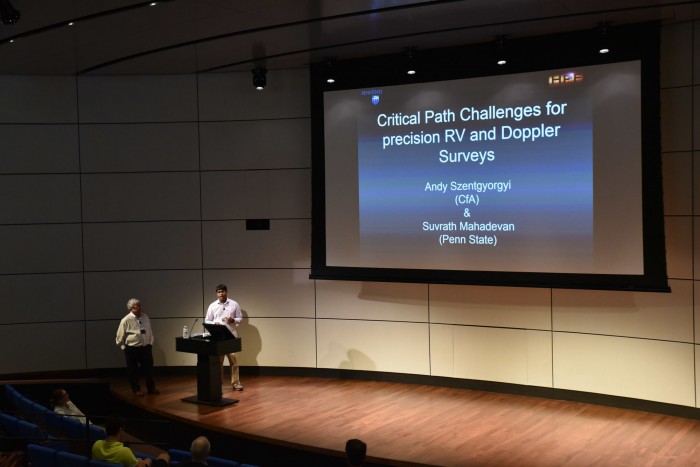
Fig 3: The challenges towards 10cm/s can be divided into three main areas: instrumentation, statistics, and understanding of photospheric signals.
“Detectors are worthy adversaries,” said Suvrath Mahadevan. We have seen improvements in both CCD optical detectors and infrared detectors. Paul Jorden gave a broad overview of the fabrication steps and the strengths of the former. In his talk Jacob Bean talked briefly about near-infrared detectors which lag behind optical CCDs in overall performance. The poor performance of infrared detectors is one of the main drawbacks with working in the infrared.
Spectrographs need to be kept thermally and mechanically stable to eliminate errors caused by environmental variations. It has thus become standard practice to decouple the spectrograph from the telescope by using optical fibers. Paul Fournier (FiberTech Optica) talked about the importance of the right choice of fibers for your instrument: “Non-circular fibers are very good at redistributing the flux from the telescope, helping with scrambling gain. Sometimes a combination of circular and non-circular fibers might work best for your application. Every fiber is essentially a new project.”
Statistics
As we push towards detecting smaller planets, it takes more sophisticated analysis. In his talk, David Hogg talked about how one can simultaneously model signals in the presence of structured noise. Eric Ford gave a discussion of the frequentist and the bayesian approach to modeling radial velocity data-sets, favoring the latter: “The Bayesian approach is great as you have to write down your assumptions, and your priors.” Tom Loredo commented on the repercussions for bad statistics for the field—”it undermines public trust in science,”—and he urged the exoplanet community to make exoplanet science the model for excellent statistical practices. “We need an astro-statistician working in every team,” said Eric Ford. A single person doesn’t have to know everything. This is why you collaborate.
Understanding Photospheric Signals
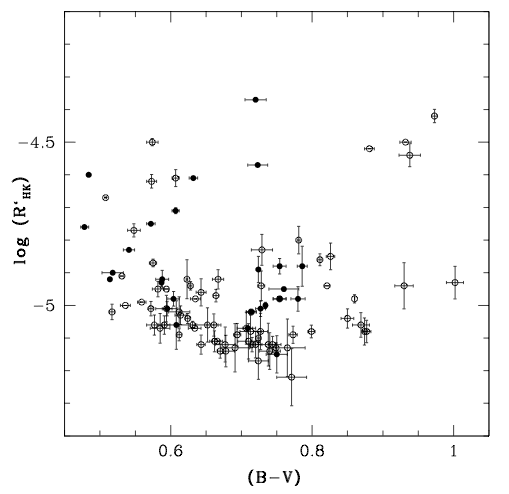
Our ultimate radial velocity precision is constrained by our physical understanding of the stars we observe. Spots, faculae, and plage on the star morph and change as the star rotates. These features—commonly referred to as stellar activity—can produce signals that can be wrongly interpreted as planets.
How can we distinguish stellar activity from a real planet? There are several ways. We can use line bisectors to characterize line profile variations. We can also use indicators that probe the presence of active regions on the star, such as photometric variations created by spots and plage. “Orbiting planets induce pure Doppler shifts, the same on all spectral lines, independent of wavelength,” said Christophe Lovis. Stellar activity signals are, however, wavelength dependent. Paul Robertson further discussed this issue, and asserted that early results show that planets can be distinguished from stellar activity. There is hope, and Pedro Figuera noted that “[p]robably the best way to check if a signal is a planet is to look at it in the near-infrared.”
Xavier Dumusque presented his results and analytics on the ‘Keplerian Fitting Challenge’, a large-scale blind test, where a number of research teams were asked to use their favorite detection method to find planets in synthetic radial velocity datasets, to better understand their limitations in presence of stellar activity noise. Some detection methods found most of the injected planets, but no method found all of them correctly. The question: “Do we need a ‘gold-standard’ analysis method?” still stands. The community liked the challenge, and agreed the challenge should be repeated later after the groups had had time to revise their methods.
A look to the future
The workshop ended by drawing together the main points from the posters, breakout sessions and the numerous presentations. In our search for Earth-like planets, there is a real need to improve the precision of the radial velocity technique, especially for the follow-up characterization of Kepler and TESS planet candidates. “No spectrograph that we currently have represents ‘The Precision Radial Velocity Dream Machine’,” said Scott Gaudi in the last talk of the workshop. Better understanding of the stellar processes behind the observed signals, robust statistics, and sustained investment in technology development are the main steps we need to take to get us closer to that goal. Let’s see where we stand during the next EPRV workshop to be held in 2017.


I am still confused as to why the “1 meter/second” bound exists with current technology. What is the physical reason for this, and what exactly is holding back new progress in spectrograph instrumentation development?