Title: Simple nonlinear models suggest variable star universality
Authors: John F. Lindner et al.,
First Author’s Institution: Department of Physics and Astronomy, University of Hawai’i at Mānoa
Status: Accepted for publication in Physica D
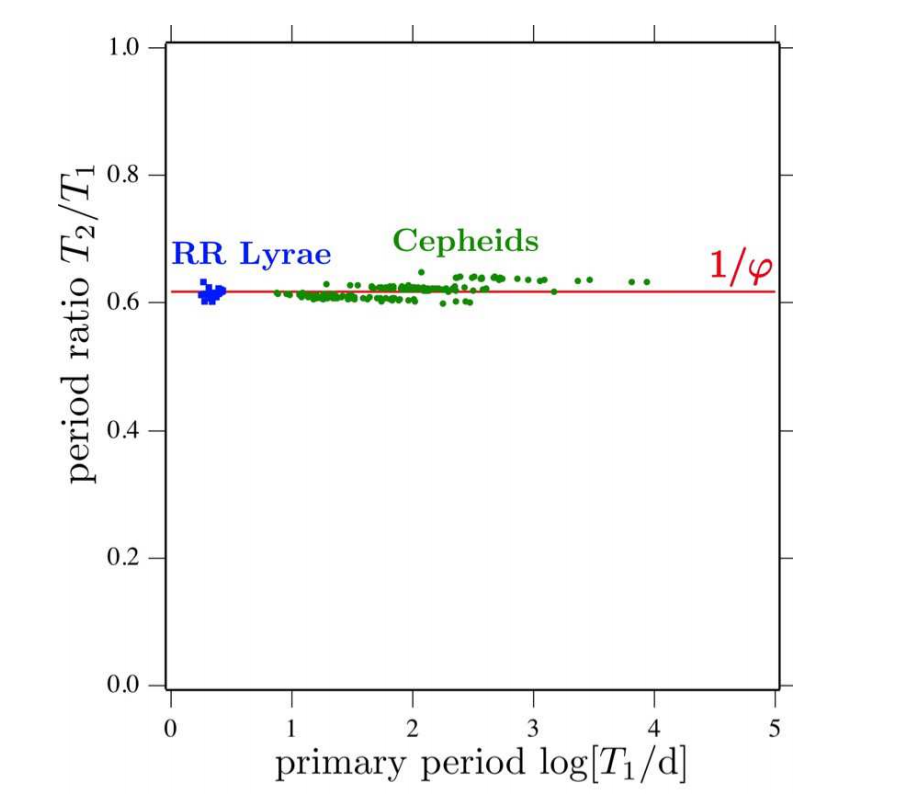
Figure 1: Figure 1: The horizontal axis shows the duration of the primary period, and the vertical axis the period ratio of the primary and secondary periods of RR Lyrae (blue) and Cepheid variable stars (green). This is a rescaling of a plot from an earlier paper by Moskalik 2014 to emphasize the clustering of the period ratios around the inverse golden ratio. This is also Figure 1 of the paper.
The Kepler mission did a lot more than just find and characterize over a thousand exoplanets; it–and other space-based missions like CoRoT–also obtained unprecedented time-series photometry that has given us new insights into the behavior of the stars themselves. Kepler, for example, looked at a Cepheid and 41 RR Lyrae stars, two types of variable stars that play an important role in cosmology as standard candles. RR Lyrae stars’ periods are shorter than those of Cepheids, ranging from 4 hours to about a day, which makes it challenging to get observations of consecutive cycles on the ground. As a space-based mission, Kepler isn’t constrained by our 24-hour days, and has made it possible to perform nonlinear time series analysis on these stars. Among others, this led to the unexpected discovery of period doubling in some RR Lyrae stars. These stars had consecutive maxima which differed in peak brightness. In contrast, a star with only one period would have the same maximum light from cycle-to-cycle. However, since we were previously only able to observe every other maxima consistently, it was easy for this to go undetected.
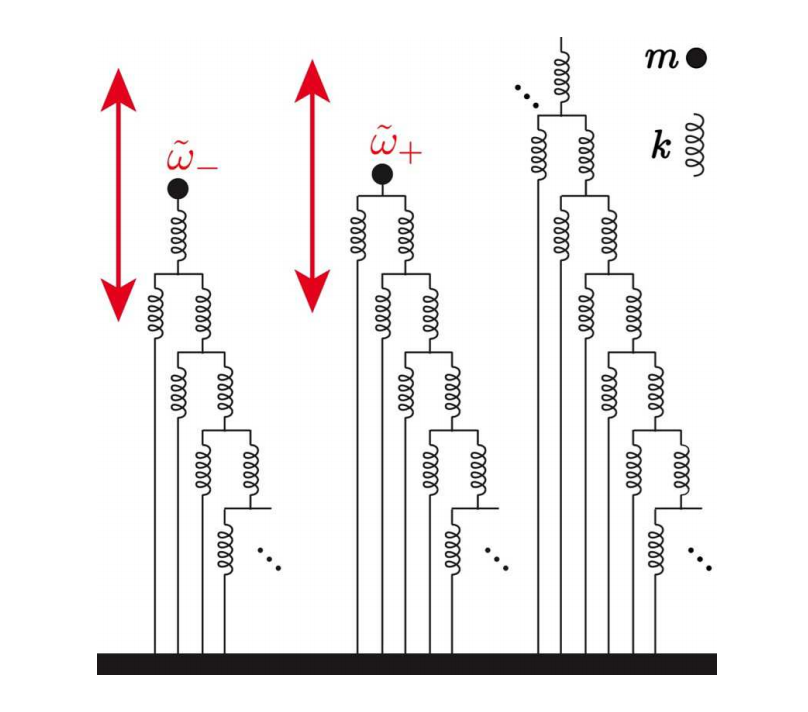
Figure 2: The “hierarchical spring network” presented in section 5 of the paper. The mass is the black ball at the end of the series of springs connected by massless rods. On the left we can see how there are two way to truncate the spring network, which lead to two spring constants and two frequencies. These are related to each other by approximately the golden ratio, as seen in real stars. This was Figure 5 of the paper.
Many RR Lyrae and Cepheid variables that are thought to pulsate with multiple frequencies have periods that are related to each other by a factor of 0.62. If this number sounds familiar, then you’re not alone in thinking so. In a previous paper, the authors of today’s paper dubbed these stars “golden stars” since they exhibit periods that are related by approximately 1/ϕ (~0.618), the inverse golden ratio. To see what the period ratios for some of these golden variable stars look like, take a look at Figure 1. The golden ratio appears in many quasiperiodic systems, something which the authors believe could point towards universality in multifrequency variable stars.
The authors of today’s paper are interested in determining if the periods of these stars just happen to be “golden” (for example, could the ratio just be caused by higher-order non-radial modes of oscillation?) or if this golden-ness is an example of the universality of variable stars (could the golden-ness arise from simple nonlinear models?). Rather than starting from hydrodynamic models of variable stars and arriving at the golden ratio, the authors use their toy models to demonstrate how the golden ratio could be introduced into variable stars from simple nonlinear models.
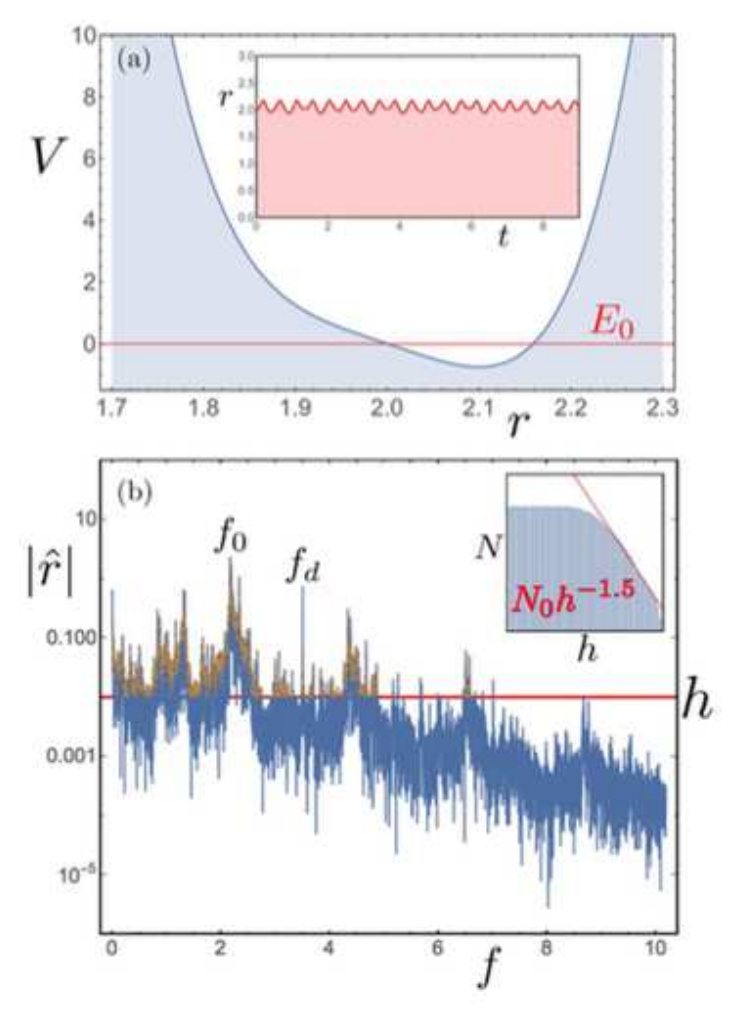
Figure 3: The “asymmetric quartic oscillator” from section 5. This oscillator has a quartic potential energy and a driving frequency that is the golden ratio times its natural frequency. The top panel shows the oscillator potential inset with what the time-series would look like. The bottom is the spectrum resulting from such a model, which they got by taking the absolute value of the Fourier transform. The red horizontal line indicates the threshold value–points above the line were counted, and points below the line were discarded. Inset in that is the spectral distribution, which shows the number of peaks in the Fourier spectrum (N) as a function of h, which increases from left to right. N seems to follow a power-law distribution with respect to h, indicating that the spectrum is rich and fractal-like. This is Figure 6 of the paper.
Section five of their paper discusses several models which could produce a golden ratio relationship in these stars, but for the sake of brevity and simplicity, we’ll limit ourselves to just two of them–the “hierarchical spring network” (see Figure 2) and the “asymmetric quartic oscillator” (see Figure 3). The former of these consists of a network of springs that terminate in a mass in two ways, creating two different spring constants and modes of oscillation whose frequencies are related to each by a factor of phi. The ‘hierarchical’ nature of this system arises from the manner in which each node is connected to the bottom layer (which you can think of as the center of the star) of the spring network (similar to gravity), and also to the next layer of the spring network (similar to pressure). They also note that in this case, the series is truncated at some point, presumably at the center of the star. This results in an approximation of the golden ratio rather than an exact value, which agrees with what they see in their observations.
In their model of the star as an asymmetric quartic oscillator, they chose a driving frequency of the oscillator that is a golden ratio times the natural frequency of the system. This produces a spectral distribution that fractal-like and similar to what they found in their previous analyses. In a star, this sort of forcing could arise from the kappa mechanism, which is thought to be responsible for the pulsing of variable stars. In this mechanism, the interior layers of the stars could be modulated by the ionized outer layers to produce periods related by the golden ratio.
We still don’t know if the golden-ness that we see in these stars is due to particulars of the higher order stellar oscillation modes or to something more universal, as demonstrated by these simple systems. The authors, however, suggest that we should not ignore the possibility of a “simple” explanation for the period ratios of variable stars. They believe that the golden ratio could be a characteristic number of multifrequency stars and conclude with the suggestion that if we look more closely, we might eventually find “chaos among the stars.”
Author
Oh, that wonderful Fibonacci equation again! An idea too pretty not to be true. Presumably the conditions only hold for regular pulsators though.
Thank you Caroline Huang for such a nice summary of our article.