Title: Is the Pale Blue Dot unique? Optimized photometric bands for identifying Earth-like exoplanets
Authors: Krissansen-Totton, J; Schwieterman, E. W.; Charnay, B.; Arney, G.; Robinson, T. D.; Meadows, V.; Catling, D. C.
First author’s institution: Department of Earth and Space Sciences, University of Washington
Status: Accepted for publication on The Astrophysical Journal
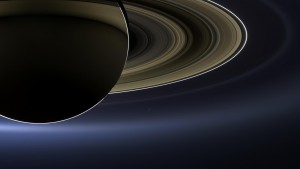
The Pale Blue Dot is seen on the lower-center of this image obtained by the Cassini spacecraft in July 2013 (click to enlarge). Credit: NASA/JPL-Caltech/SSI.
Almost three decades after Carl Sagan coined the “Pale Blue Dot,” we are planning telescopes and instruments that will be able to probe the inner secrets of planetary systems beyond ours, such as WFIRST, ATLAST, E-ELT and TMT, just to name a few. In this context, we may ask: how can we find another pale blue dot?
In astronomy, the color of an object is a rather plastic idea: it is the amount of light it gives off (or reflect) in a given range of wavelengths. Shorter wavelengths are said to be bluer and longer ones are redder. We can measure the color of an astronomical object either by photometry or spectroscopy. The first is usually faster and cheaper to perform than the second, but the results are not as detailed.
One way to obtain crude but crucial information about astronomical objects is by analyzing their ratio of colors. The authors of today’s paper suggest that we use this approach to identify exoplanets possibly similar to Earth. But we need to define a system of colors that will make Earth-like exoplanets stand out among others. In other words, we need to minimize the number of false positives.
Redefining colors
This study performs a clever and objective search for the best set of colors with the help of an algorithm. They take the reflected light’s spectra of various worlds in the Solar System, create some hybrid model spectra (e.g. snowball planets, Mars- and Galilean moon-like worlds with thick atmospheres), and compare the colors of these objects measured by different color definitions.
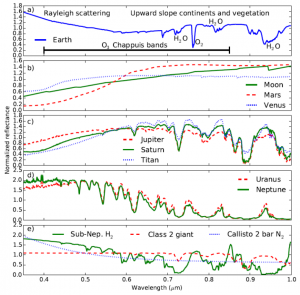
Figure 1: The spectrum of Earth’s reflected light as seen from space (top panel, notice the U-shape), other objects of the Solar System (second, third and forth panels) and model objects (bottom panel). The Chappuis bands are the regions of the spectrum where absorption of light by ozone occurs.
There is one aspect on the spectrum of the reflected light of the Earth that makes it a bit more unique than other planets: it has a subtle U-shaped feature from the ultraviolet (UV) to visible wavelengths (see figure 1). This is caused by Rayleigh scattering, continental reflectivity (which includes some vegetation) and light absorption by ozone. Furthermore, it requires both oxygen-producing life and an active hydrological cycle which produces the components that make our atmosphere clear of haze-forming species. Giant planets, like Uranus and Neptune, although blue, have a lot of haze in their upper atmosphere, lowering their reflectivity and differentiating them from Earth.
Making Earth-like exoplanets stand out
The search yields the best color set (their wavelength ranges) defined as follows: red = 770-894 nm, green = 569-693 nm and blue = 431-531 nm. The color-color diagram using this set is shown on figure 2. This diagram consists of two axes, each one corresponding to a ratio of colors. We can see that the Earth (blue circle) stands out nicely, but there is a hint of mixing with other worlds (most of them icy, colored symbols). Additionally, the authors find that 100% cloud cover at any height of the exoplanet’s atmosphere moves it closer to the icy false positives.
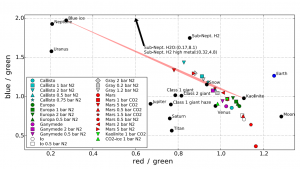
Figure 2. The color-color diagram of planets. Notice how Earth (blue circle) stands out from the other worlds (black symbols). The colored symbols are icy worlds which can possibly be false positives. The red region are snowball worlds.
Remember that we are talking about directly imaging exoplanets, which requires really long observations, and characterizing them is even more time-consuming. The photometry-based method we showed here could have a huge advantage over using spectroscopy, as long as it takes less integration time to make a simple characterization of the planet. The authors found that, for the first generation coronagraph-equipped space telescopes, it would be possible to identify a potential Earth-like planet twenty times more quickly using the proposed photometry method than using spectroscopy.
By reworking some definitions of colors, this study found a combination which makes it easiest to separate Earth from other non-habitable planets, just by applying simple photometry. So, yes, in the near future, we will definitely be seeing other pale blue dots, and each of every little photon will count.


