Paper Title: Spectral Confusion for Cosmological Surveys of Redshifted C II Emission
Authors: Alan Kogut, Eli Dwek, Samuel Moseley
First Author’s Institution: Goddard Space Flight Center
Paper’s Status: Accepted by ApJ
This is a guest post by Caitlin Doughty, a graduate student at New Mexico State University. She is working with Dr. Kristian Finlator to study the ultraviolet background at the epoch of reionization using numerical simulations.
[C II] Fine Structure Line Provides a Near-Perfect Tracer
It is difficult to study the very far reaches of space. Even the brightest galaxies become impossible to see at some distance, as their light becomes too faint for instruments to measure. Consequently there are limitations on the types of observations that are useful for studying fine galactic features at large distances.
Typically, surveys use the spectral lines (radiated energy at certain wavelengths of light) of neutral hydrogen as a tracer of structure at cosmological distances due to its abundance in galaxies. However, it proves to be a poor tracer of the gas within the dynamic regions of galaxies around star formation or outflows. This consideration has prompted astronomers to look to other spectral emission lines as potential structure tracers, in particular, redshifted emission lines. Singly ionized carbon ([C II]) has strong emission lines which result in cooling of the parent gas cloud. [C II] is ubiquitous within dynamic structure and has been shown to result in stronger emission lines than those provided by other possible tracers. Perhaps most importantly, it is visible at large distances because the line’s characteristic photon wavelength is short enough to avoid interlying gas. With observations of [C II], comparison of the strengths of different spectral emission lines provide a probe of the physical conditions within the gas cloud.
The Problem With Assumptions
Using the [C II] emission line as a tracer of galactic structure results in some practical problems. The primary issue lies in the fact that, while [C II] is typically the strongest line for any observed structure, it is not the only far infrared (FIR) line; several different transitions of oxygen, nitrogen, carbon monoxide, and even neutral carbon also create FIR lines which can lie close together when viewed in a spectrum. Further, a spectrum contains lines from all objects lying in the line of sight, resulting in contamination by emission lines unrelated to the desired target. In fact, only 16% of the lines which appear in the wavelength region of interest will typically correspond to [C II]. This causes problems because it is typically assumed that the brightest lines appearing in any spectrum are [C II], but a high density of FIR lines due to the above problems causes significant overlap of the lines and, ultimately, line misidentification. Thus, it is not straightforward to pick out [C II] from a crowded field. Kogut et al. 2015 quantifies the odds of incorrect identifications and presents a simple, iterative algorithm to distinguish the prominent [C II] emission from other FIR signals.
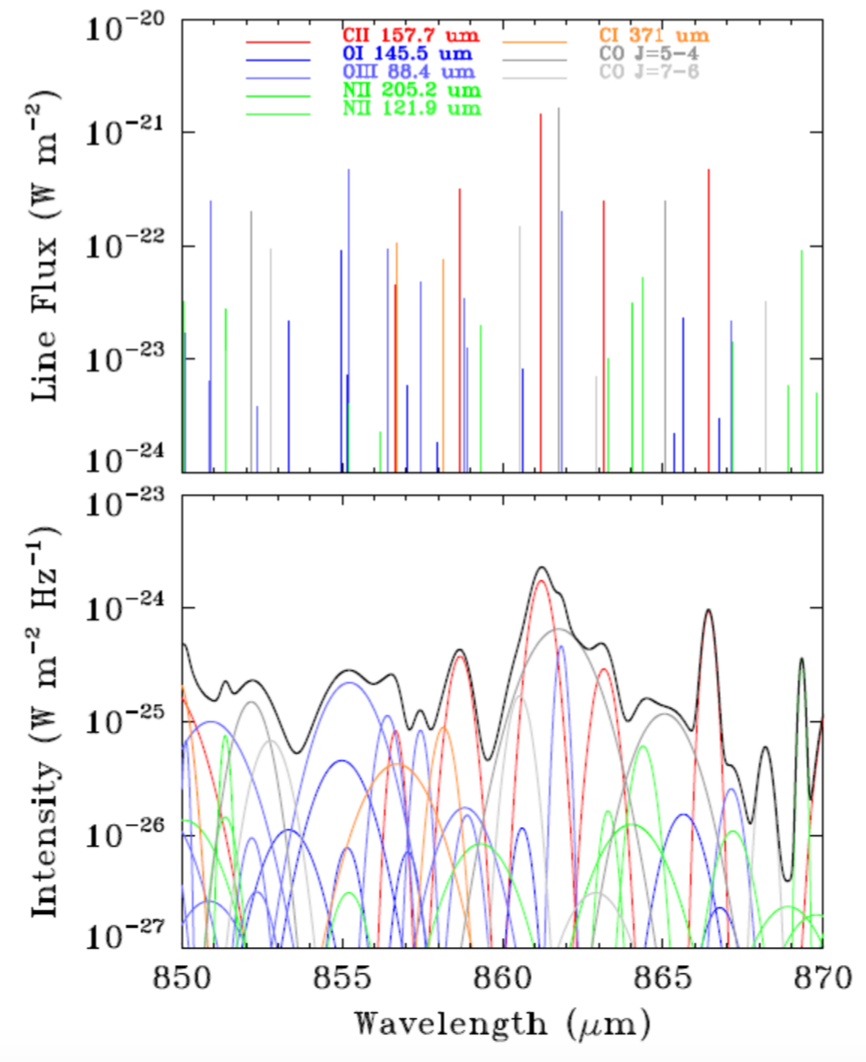
Kogut et al. 2015, Figure 2: The upper plot shows an idealized simulated emission spectrum with lines coming from several different types of atomic transitions. The lower plot shows a simulation of the upper spectrum once typical line-broadening effects are introduced. Notice the high degree of overlap between different colored lines, which results in a combined spectrum represented by the black line.
A Simple Solution
The authors used simulations of galaxy distributions, with each galaxy assigned a model spectrum of FIR lines covering wavelengths from 150 to 300 microns, to generate composite spectra incorporating the contributions from each galaxy along a line of sight, then used the results to test their proposed identification method. The process begins with an iterative algorithm choosing the strongest emission line from a composite spectrum and identifying it as [C II]. It then uses known line brightness and position relationships to search for other lines stemming from the same region of space as the parent [C II]. Once a series of related lines is assembled, the entire set is flagged and removed from further consideration. A second strongest emission line is selected and the same progression ensues. Since the spectra were artificially derived, the true identity of each line was known, and these identities were compared to the algorithm’s assignments.
The results are promising. When considering only the brightest 50% of lines, the error rate of this method was found to be only 7%, clearly a significant improvement compared to the 33% error rate arising from current methods. However, there are situations where the algorithm’s performance was less than stellar. Significant errors in line identification arose from a high amount of overlap of different source spectra, and identifications for distant targets, with more sources falling within the line of sight, became less reliable. Analysis of the most distant simulated sources was actually more likely to generate an incorrect identification than a correct one.
Although that is disheartening, there is good news. As technological advancements allow for higher resolution surveys, the separation between line cores in spectra will grow, greatly decreasing overlap between sources. This simple algorithm is shown to be an accurate way of identifying the [C II] line for reasonably bright, nearby sources, with a success rate of 93%. This bolsters the ability of [C II] to probe very distant structures, and lays the groundwork for improving future analysis of cosmological survey data.
Author