Title: Runaway freeze-out of volatiles in weakly turbulent protoplanetary disks
Authors: Rui Xu, Xue-ning Bai, Karin Öberg
First Author’s Institution: Princeton University
Status: Submitted to ApJL
Close to 90% of the mass in nearby protoplanetary disks is missing, according to the latest measurements by ALMA. The leading suspect right now is… Elsa. That’s right! Elsa has been messing with our protoplanetary disks! She has been freezing all of the carbon monoxide (CO) in the outer parts of the disk, making it undetectable. (CO is only detectable in the gas phase.)
Before we can understand what Elsa is up to and why so much disk mass is missing, let’s first go through how to measure the mass of a disk, specifically the much larger gas component.
How to Measure a Disk’s Mass from its Gas
In order to measure the disk mass directly from the gas, we need spectral lines. These lines appear brighter or fainter depending on whether there is more or less material in the disk. Unfortunately, nearly all of the gas is hydrogen (H2), a molecule with no detectable lines in disks. This leaves us with no choice except to use carbon monoxide (CO), the 2nd most abundant molecule in a disk instead.
A previous study worked out the fluxes of spectral lines from carbon monoxide one would expect to measure for disks with a wide variety of parameters, including the disk mass. As it just happens to be the case, they found that measuring the fluxes of a spectral line from two different isotopes of carbon monoxide (13CO and C18O) can constrain the disk mass to within a factor of about 3, regardless of any of the other disk parameters! To see how that works, let’s do an example:
- [Step 1] We measure the flux of the 13CO line to be 1,000,000. Thus, we know the disk mass is between 3 and 100 Jupiter masses (see vertical line in Figure 1 below).
- [Step 2] Meanwhile, we also measure the flux of the C18O line to be 100,000. Thus, we know the disk mass is between 3 and 30 Jupiter masses (see horizontal line in Figure 1).
- [Step 3] If we combine the two, we know the disk mass has to be between 3 and 10 Jupiter masses (see encircled point in Figure 1).
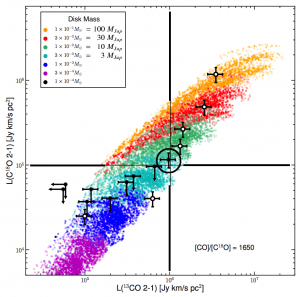
Figure 1. Diagram for determining disk masses. Each colored point indicates the simulated fluxes for two different spectral lines for a set of disk parameters. Points that are the same color have the same disk mass. The example point is circled. Adapted from Williams and Best 2014, Figure 6.
Megan Ansdell et al. used this method to measure the masses of 61 disks and found that most of them are more than 10 times less massive than the Minimum Mass Solar Nebula (MMSN, see Figure 2 below), the standard model for the protoplanetary disk that surrounded our Sun shortly after it was born. Where could this missing disk mass be?
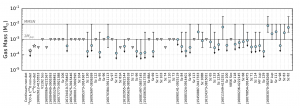
Figure 2. Measured disk masses (blue points; triangles are upper limits). Most are much lower than the total mass of the MMSN (10 Jupiter masses). Adapted from Ansdell et al. 2016, Figure 3.
Frozen Uncertainty
In order to extrapolate the full disk mass from just the CO in the method above, we needed to assume a value for the ratio of CO-to-H2. From the interstellar medium (where H2 can be measured directly), we know this ratio should be about 1-to-10,000. However, that ratio is for all of the CO in the disk, even though only CO in the gas phase emits spectral lines. Any CO that is frozen solid would be missing and unaccounted for in the flux measurement.
Ansdell et al. assumed that less than 5% of the CO was frozen (based on simulations), a small enough amount that it would not affect the measurements of the total disk masses. However, if most of the CO in the disk (> 90%) were frozen, then each of the measured disk masses would increase by at least tenfold, enough to make them consistent with our model of the MMSN.
If this is the reason so much disk mass is missing, what is causing such a high fraction of the CO to be frozen solid?
(Don’t) Let it go
The simplest explanation is that the Disney Universe is real and Elsa is out there in space freezing most of the CO in protoplanetary disks.
In an effort to vindicate Elsa as the hero we all know and love, Ray Xu et al. explore a different idea in today’s featured paper. They start from the assumption that the disk’s temperature varies at different heights, the main reason some of the CO in the disk is already expected to be frozen. The outer surface layers of a disk shield the inner layers from some of the star’s radiation, keeping the surface much hotter than the middle layers. The temperature drop in the these middle layers is enough to freeze CO from a gas to a solid. With this structure though, less than 5% of the CO ends up frozen.
Besides the temperature varying, Xu et al. note that the disk’s surface layers also shield the middle layers from effects that would ionize molecules. With more ionization at the surface, these layers are also more viscous (more turbulent) compared to the inner layers in the middle. The more turbulent a part of a disk, the more its molecules are free to move around or even leave. With less turbulence, they are stuck where they are. This results in a two-part effect:
- The CO molecules in the hot surface layers are free to move to the cold inner layers – where they will freeze – because the surface layers are more turbulent.
- Meanwhile, any CO that ends up in the cold inner layers is stuck because these layers are less turbulent (see Figure 3).

Figure 3. A disk’s structure around a star. The surface layers are hot and more turbulent. The middle layers are cold and less turbulent. This traps the CO in the middle, where it is frozen and cannot be detected with spectral lines. Adapted from Figure 1 of the featured paper.
If the middle were also turbulent, it would have been able to let the frozen CO go back to the surface, where it could have sublimated back to the gas phase.
Instead, Xu et al. find that CO slowly accumulates in the cold and less turbulent middle layers, with as much as 90% ending up frozen solid for some particle sizes. Perhaps, Elsa is not the culprit in the Case of the Missing Disk Mass after all. While this mechanism may not freeze this much CO in all cases, its effects combined with other disk processes may be enough to solve this case once and for all.
Many thanks to my officemate Rixin Li for giving a presentation related to this topic while I was preparing this Astrobite.
Featured Image Credit: Avi Mandell, NASA GSFC
Author