Title: The COSMOS [O II] Survey: Evolution of Electron Density with Star Formation Rate
Authors: Melanie Kaasinen, Fuyan Bian, Brent Groves, Lisa Kewley, and Anshu Gupta
First Author’s Institution: Research School of Astronomy and Astrophysics, Australian National University
Status: Submitted to MNRAS
The last two decades of galaxy research have made it very clear that star formation in galaxies peaked at a redshift of z ~ 2, which occurred about 3.5 billion years after the Big Bang. In the approximately 10 billions years since then, the number of stars forming per year, or star formation rate, has been universally decreasing. This peak in star forming activity at z ~ 2 is often referred to as “cosmic noon.” While we know that since cosmic noon, galaxies have continued to become both larger and more massive, the specific reason for this decrease in the rate of star formation remains an open question.
To really delve into this problem requires understanding exactly what is going on in the specific regions of galaxies where the stars are forming. What is the nature of these stellar nurseries? Is the gas dense? Is the gas rich in metals? How energetic is the radiation in these environments? Answering these questions requires detailed investigation into what the spectra of these galaxies are telling us. For example, astronomers compare emissions lines of elements like hydrogen, nitrogen, sulfur, and oxygen and find that galaxies at cosmic noon have more ionized nitrogen and oxygen compared to hydrogen than their lower redshift counterparts. We say an atom has been “ionized” when an electron has been knocked out of its orbit around the nucleus of the atom. This process requires an input of energy to pry the electron loose. Therefore, we know that if we have more ionized atoms, the environment is probably filled with more energetic photons capable of ionizing those atoms. In this way, studying the abundance of ionized atoms in galaxies can tell us about what is occurring in the star forming regions.
In today’s paper, the authors are specifically interested in studying the evolution of electron density with redshift to understand how this affects the star formation rates of galaxies. Electron density is the number of electrons in a given volume of space, and is directly related the how much ionization has occurred in a region of a galaxy. They are specifically interested in the content of singly-ionized oxygen, denoted as [O II], and singly-ionized sulfur, or [S II]. Singly-ionized means that only one electron has been knocked out of the atoms. Both the [O II] and [S II] ions may seem to be single emission lines at 3727 Å and 6720 Å, respectively. However, if the spectrum has enough detail, you can zoom in on these lines and find that each one of them are actually two distinct lines, called a doublet. The [O II] doublet separates into two peaks at 3727 Å and 3729 Å, while the sulfur double occurs at 6716 Å and 6731 Å. The ratios of these doublets have intrinsic values (a quick summary of the physics can be read here), and any deviation from these values tells us what the electron density is in the region. Here, the authors compare two samples of galaxies — one a set of local galaxies, and the other a set of high-redshift (z ~ 1.5) galaxies — to trace any change in electron density with redshift since cosmic noon.
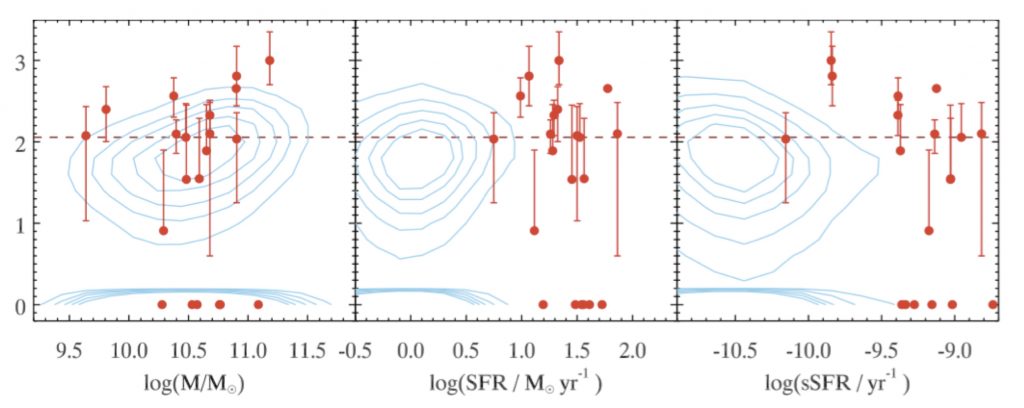
Figure 1: Electron density versus various physical properties of this sample of galaxies. The blue contours represent the local sample of galaxies from SDSS, while the red filled circles denote the galaxies from the higher redshift sample. The red dashed line shows the median electron density for the high redshift sample.
The higher-redshift data used in this work comes from the Hubble Space Telescope (HST) and from the DEep Imaging Multi-Object Spectrograph (DEIMOS) on the 10-meter Keck II telescope on Mauna Kea in Hawaii. The final set of spectra consisted of 103 galaxies with well-measured [O II] content at a redshift of 1.4 < z < 1.7. This sample of galaxies was compared to a sample of 123,652 local galaxies from the Sloan Digital Sky Survey (SDSS). The electron densities were then calculated for each sample, and are shown plotted in Figure 1. The figure shows the electron densities plotted as a function of stellar mass of the galaxies, the star formation rate of the galaxies, and specific star formation rate, which is simply the star formation rate divided by mass. The low-redshift sample is shown with the blue contours and the high-redshift galaxies are denoted by the red filled circles. The authors find that the electron density does evolve with redshift. However, the driver of this evolution seems to be only the increase in star formation rate at higher redshift, as shown in the center panel of Figure 1. When they compare the high-redshift galaxies with local galaxies of the same star formation rate, this evolution disappears, as shown in the bottom, left panel.
The takeaway is that it is the change in star formation rate that is changing the electron density with redshift, rather than any other galaxy properties such as mass. Therefore, the increased content of ionized oxygen and nitrogen with respect to hydrogen is likely driven by the increased star formation rate. This could be due to the fact that the presence of star formation means more massive, young stars, which in turn means more energy is being released into the environment via shocks and stellar winds. This would cause the the pressure and density of the regions to increase. This work is part of a bigger effort to understand how the environment in galaxies affects the rate of star formation, as well as how the star formation affects the galactic environment. The authors plan to pursue these questions further using their high-redshift sample of galaxies.
Author
Trackbacks/Pingbacks