Title: Cosmological-parameter determination with Microwave Background Maps
Authors: G. Jungman, M. Kamionkowski, A. Kosowsky and D. N. Spergel
First Author’s Institution: Dept. of Physics, Syracuse University, New York, USA
Status: Physical Review D (1996), [open access]
There are papers that talk of groundbreaking discoveries. There are papers which review the current status of the field, akin to bringing you up-to-date with what’s going on. And then there are papers that open up portals to new sub-fields, with the clarity of their message and the precision of the questions they pose. Today’s paper is one such publication, which in 1996 started an interesting journey in the world of Cosmic Microwave Background (CMB) and Observational Cosmology.
The Beginning
Discovered for the first time in the 1970s, CMB studies have relied on measuring the temperature of this relic radiation today, which has sent photons to us from the era when the universe was essentially a plasma of matter and radiation. This era of the universe is where we can see the earliest ‘CMB photons’, a surface aptly called the surface of last scattering. Measuring its temperature gives us an idea about the energy content of the universe at that surface, which decreases as the photons travel towards us and lose energy in an ever-expanding universe.

Fig 1. The CMB Temperature map of the entire sky, observed by WMAP (as of 2012). The different colors correspond to different temperatures, at the minute scale of micro-Kelvins.
It was discovered in 1992 by the Nobel prize-winning satellite COBE that this radiation was isotropic to one parts in 100000, i.e. the uniformity of the CMB temperature across two points in the sky was only different by 10^-5! Following this, studies were undertaken to discuss what these anisotropies, or non-uniformities actually meant. Today, we know of several mechanisms that answer this question – mechanisms that have gained credence with results from CMB telescopes like WMAP, PLANCK, the Atacama Cosmology Telescope, and the South Pole Telescope. But back in 1996, these programs did not exist. The authors of our paper undertook the task of figuring out the theory of a future mission that could conclusively tell us about the nature of the universe back at the last CMB surface. This in turn, would help us characterize the early universe as well as the evolution of the universe between us and the surface of last scattering. What is the study of the evolution of universe since the big bang, but observational cosmology!
Cosmological Parameters
Observational cosmology is a game of measuring the following parameters with utmost accuracy and precision:
- Total Density of the universe Ω – baryonic matter, dark matter, radiation, curvature/space
- Hubble Constant H0, acceleration of the universe
- The Cosmological Constant Λ, responsible for the accelerated expansion of the current universe
- Inflation parameters, to constrain the perturbations of pre-CMB and near-CMB era universe
- Mass of neutrino species, that affect structure formation in the universe
- Ionization history of the universe
Where do CMB observations come into the picture here? CMB is mostly measured in the form of temperature maps, a representation of the energy of the CMB photons across the sky (now, and by extrapolation back in the early universe). This information is best displayed as temperature differences as a function of angular scales in the sky, or ell’s as they are called. The term ell (or l) comes from the fact that on a 3-D sphere like the universe, the best way to compare two different points is to expand the temperature using spherical harmonics (which have ell’s or l in them), just as we expand points on a 2-D surface in terms of sine and cosine. If ell’s are hard to imagine, angular scales are more intuitive (check top axis on Figure 2)!
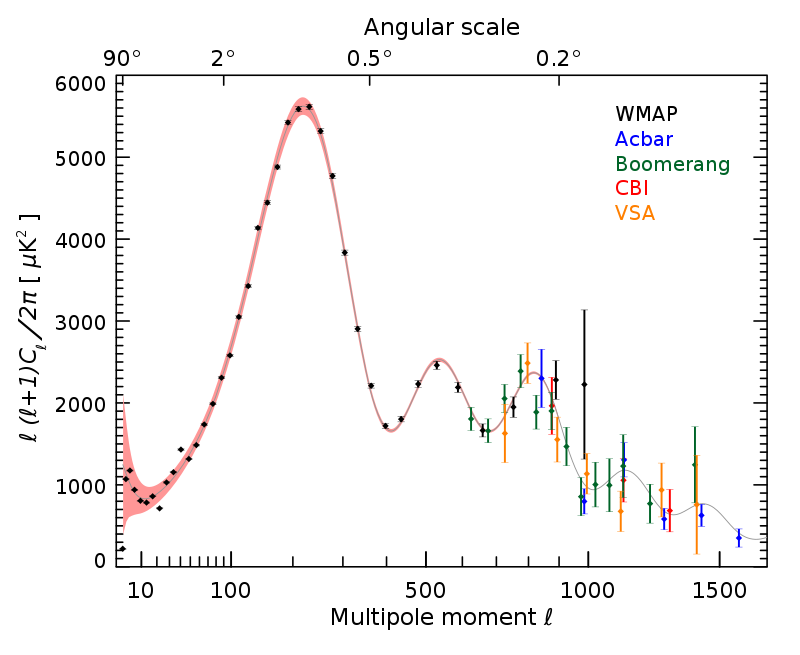
Fig 2. Anisotropies as a function of angular scale (or ell’s) in the sky, as observed by different telescopes e.g. WMAP, Boomerang. The solid line is a theoretical model that fits the observations.
A better resolution of the telescope allows us to distinguish between temperatures in nearby regions, i.e. at smaller scales (or higher ell, in CMB lingo). A better sensitivity allows us to capture minute differences in this temperature. The authors in today’s paper assume a sensitivity and resolution better than COBE, and talk about their projections of a future experiment (which turned out to be WMAP)!
CMB Anisotropies: Predictions
The authors go about their predictions by describing the basic accepted theory (at the time) surrounding CMB generation, and what could have possibly caused the width and peaks of the anisotropies look the way they do (seen in Fig 2). Let’s see if we can capture a few of the ideas put forward here.
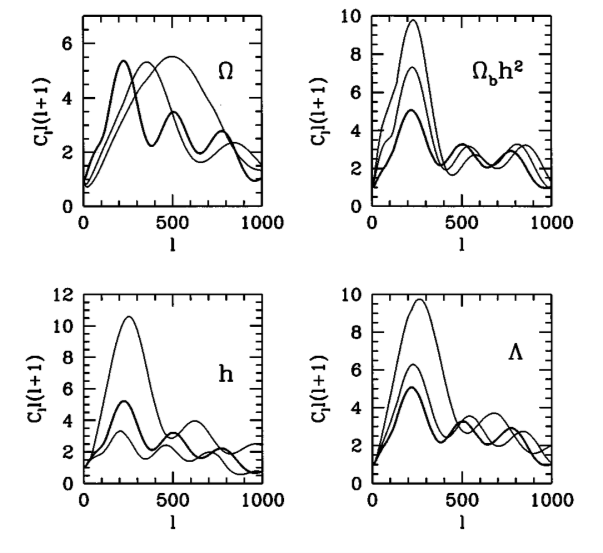
Fig 3. Different predictions of cosmological parameters as a function of ell’s (or angular scale), from today’s paper. Each solid line in each panel is a prediction of the CMB map for a specific value of that parameter, keeping the other three parameters constant.
- If the cosmological constant is too high in the universe, it increases the distance between us and the surface of last scattering, and subsequently in the anisotropy map.
- Moreover, if there is more structure between us and the CMB because of the evolution of the universe(e.g. galaxy clusters), that would make the photons scatter more off this structure, and hence increase the peaks (or strengths) of these anisotropies.
- If more perturbations were going on when the CMB was a plasma(at a time when the universe was tiny and most of the points in the sky were in close proximity with each other), the anisotropies seen at large scale NOW (that used to be close by back then) would be larger. Hence, this would mean higher peaks at lower ell, or higher angular scales.
- The biggest peak in Figure 2, is seen at an angular scale (or ell) of the horizon at surface of last scattering. We call this a horizon, because that is literally the edge of the universe that could communicate with each other back in the CMB era. This was a fixed physical scale, but what it looks to us today depends entirely on whether our universe is flat, closed or open. For example, in an open universe (like a sphere), the subtended angular scale would look wider than in a flat universe. Hence, the spectrum would move to a lower ell (or higher scales).
What has happened since?
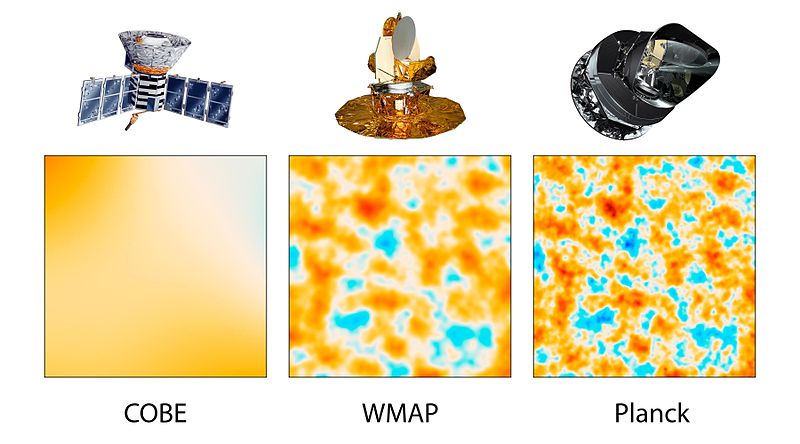
Fig 4.The three squares are 10-square degree patches of the sky. The difference in colors are displaying the different resolution and sensitivities of the three generations of CMB telescopes. COBE kickstarted the field of CMB anistropies, while Planck clearly sets the current standards.
Predictions like these form the core content of this paper, which led to several anisotropy studies in the future. WMAP, the natural all-sky successor to COBE, put amazing constraints on CMB anisotropies in temperature in 2001 (Fig 1). The Planck satellite is the current standard for CMB studies at low-ell (large angular scales e.g. across the sky), with SPT and ACT contributing to high-ell (smaller angular scale e.g. galaxy clusters) studies. The future is even brighter for CMB (literally, and metaphorically), as we look forward to higher sensitivities, and resolution that helps with smaller and smaller angular scales in the sky.
As John Carlstrom – astrophysicist at the University of Chicago and a pioneer in CMB studies – rightly says, “CMB is a gift that keeps on giving!”
For detailed studies on CMB evolution and observational cosmology, look up these amazing tutorials by Wayne Hu and Max Tegmark!
Author
Trackbacks/Pingbacks