Authors: A. Suárez Mascareño and many others
First Author’s Institution: Instituto de Astrofísica de Canarias, E-38205 La Laguna, Tenerife, Spain; Observatoire Astronomique de l’Université de Genève, 1290 Versoix, Switzerland
Status: Submitted to arXiv [open access]
Possible planet… or stellar sham?
The search for life as we know it on Earth-like, rocky exoplanets has been a driving force for many telescope missions of the new century. And, as today’s authors point out, M-Dwarfs seem more and more like great places to look.
M-Dwarfs (aka Red Dwarfs) are typically really dim, lightweight stars (relative to the Sun), which seem to account for most of the stars in the universe. Because M-Dwarfs are so small and faint, the signs that planets are orbiting them show up more clearly than for planets orbiting Sun-like stars.

Figure 1: An artist’s gorgeous impression of an M-Dwarf and its orbiting planets. Image Credit: NASA/JPL-Caltech
Consider, for example, the radial velocity (RV) method for detecting planets. This method relies on the fact that, for a star-and-planet system, the star is not completely stationary as the planet orbits around it. Just as the star’s gravity tugs on the planet, so too does the planet’s gravity tug on the star. This tug makes the host star ‘wobble’ around in its own orbit in response to the orbiting planet. The size of this wobble is larger for M-Dwarfs than for Sun-like stars, because M-Dwarfs are so much less massive – which means that the signature wobble for M-Dwarfs, in theory, should be easier for astronomers to detect.
In practice, however, there are other factors that can complicate the detection of this signature wobble for M-Dwarfs – like stellar activity. As time passes and a star rotates, stellar features, like starspots and granules on the star’s surface, can shift, flare, and fade in and out of view. Unfortunately the signals we see from these sorts of stellar activities can have the same magnitude as the signals we see from stellar wobbling due to orbiting rocky planets.
That’s where today’s authors come in. By mapping the distributions of various stellar cycles for a survey of M-Dwarfs, the authors aim to make it easier to distinguish between signals of stellar activity and signals of orbiting planets.
Statistics of an M-Dwarf survey
The authors worked with observations of the M-Dwarfs in the HARPS-N Red Dwarf Exoplanet Survey (aka HADES, but not Hades). Its HADES Radial Velocity Programme is a survey put in place to find rocky exoplanets orbiting M-Dwarfs visible from the northern hemisphere. This survey has been operating and observing since 2012, and has already led to several exoplanet discoveries of super-Earths.
After much data reduction, calibration, and processing of their new observations, the authors calculated and estimated several measurements of stellar activity (listed below). They then combined their measurements with previous M-Dwarf datasets, thus producing the following total dataset of measurements:
- Chromospheric activity levels (72 from these authors, 129 total)
- Rotation periods (33 from these authors, 90 total)
- Magnetic cycle lengths and detections (18 from these authors, 47 total)
- Rotation-induced RV signals (16 from these authors, 35 total)
With this combined dataset, the authors were able to view their new measurements within a broader context, as well as perform stronger statistical analysis of the M-Dwarf data overall.
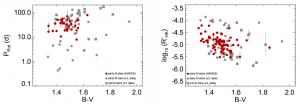
Figure 2: Plots showing distribution results for the M-Dwarfs in the survey. Both plots graph stellar color, which is an indication of stellar mass, on the x-axis (smaller values are bluer and heavier, larger values are redder and more lightweight). The left plot (Figure 2a) graphs rotation period (in days) along the y-axis. The right plot (Figure 2b) graphs an indication of chromospheric activity along the y-axis (where smaller values mean lower levels of activity). In both cases, red dots correspond to new measurements from this work, while gray dots correspond to work from previous research groups. From Figures 10 and 9 in the paper.
The authors noted a number of characteristics of their measured distributions. They found, for instance, that their combined sample contains very low levels of chromospheric activity overall, as shown in Figure 2b, with the mean level being quite close to the mean activity level of the Sun. This result is as they would expect for a planet-finding survey. The authors also recorded a downward trend between chromospheric activity and mass, where the lower mass stars tend to have lower mean chromospheric activity levels.
In addition, the authors found that the M-Dwarfs in their sample are usually slow rotators, as main sequence M-Dwarfs are expected to be. Figure 2a illustrates the distribution of rotation periods for the combined measurements. Here again, the authors noted a downward trend, where lower mass M-Dwarfs correspond to lower rotation periods. They argue that Figure 2a points to two groups of M-Dwarfs in their sample – one of fast rotators, and another of slow rotators – which are most likely caused by the sample having a range of ages.
With statistical surveys like these, we can better understand the stellar behavior and cycles of the M-Dwarfs we observe. And from the trends and patterns that we gleam within these surveys, we can better recognize signals of their stellar activity – so that we can distinguish these signals, see past them, and better perceive any planetary gems that are hidden beneath.
Author
where is M-Dwarf?