Title: Detecting metal-poor gas accretion in the star-forming dwarf galaxies UM 461 and Mrk 600
Authors: P. Lagos, T.C. Scott, A. Nigoche-Netro, et al.
First Author’s Institution: Instituto de Astrofísica e Ciências do Espaço, Universidado do Porto, Portugal
Status: Accepted by MNRAS, open access on arXiv
Islands in the sky?
When galaxies were first discovered, they were sometimes called “island universes.” It’s actually a pretty apt comparison—like islands, galaxies are complex systems with lots of individual components.
However, the word “island” is sometimes associated with isolation. “No man is an island entire of itself” goes one famous poem; over the last several decades, astronomers have come to realize that no galaxy is an island, either. Galaxies themselves interact with each other and with their environments, and understanding how this happens is one of the main questions in galaxy evolution.
Studying dwarf galaxies may be one way to answer this question. These small, dark-matter dominated systems—miniature islands—are particularly susceptible to external interactions. Also, under the current paradigm of hierarchical galaxy formation, larger structures are made of smaller structures—so dwarf galaxies are also the building blocks of larger galaxies. All these factors make dwarf galaxies good test beds for studying the role of environmental interactions in galaxy evolution.
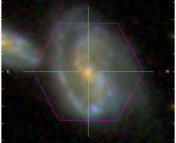
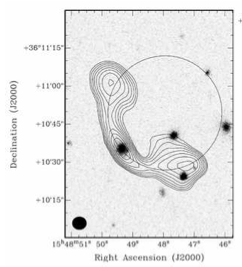
That’s where today’s paper comes in. Lagos et al. aim to study environmental effects in two particular dwarf galaxies, UM 461 and Mrk 600 (Figure 1).
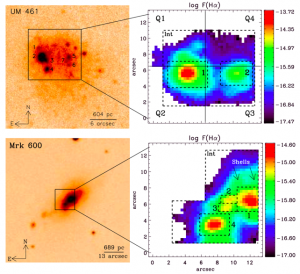
Figure 1. (Top) UM 461 in the near-infrared K band (top left) and H emission map (top right). (Bottom) Mrk 600 in the optical R band (bottom left) and H
emission map (bottom right).
Putting the pedal to the metal
To figure out what kinds of environmental effects are happening in these dwarf galaxies, the authors use a relatively new technique called integrated field unit (IFU) spectroscopy. This method is sort of a combination of imaging and spectroscopy: instead of measuring the amount of light at a number of pixels (an image) or measuring the amounts of different wavelengths of light for the overall galaxy (a spectrum), IFUs allow you to measure spectra at every single pixel.
This is super useful, because spectra can be used to measure things like chemical compositions. In particular, astronomers measure the abundances of metals. This is a prime example of astronomers being terrible at naming things; to astronomers, “metals” are any elements that are heavier than helium.
Measuring the abundances of metals in a galaxy’s gas (gas-phase metallicities) is hard as heck and not very precise. It’s also pretty difficult to measure all the elements heavier than helium, so most people use oxygen as a proxy for all metals.
There are a few different ways to measure how much oxygen is in a galaxy. Here’s a brief rundown:
- “Direct” (electron temperature) method
You measure the strengths of two different spectral lines: the [OIII] line at a wavelength of 4363 Angstroms, and another [OIII] line at 5007 Angstroms. Both of these lines are produced by collisional excitation (free particles collide with an atom, exciting an atomic electron into a higher-energy state; when the electron transitions back to the ground state, it produces an emission line).
The [OIII] line at 4363 Angstroms requires more energy to produce than the 5007 Angstrom line–this means that if the 4363 Angstrom line is stronger than the 5007 Angstrom line, then it’s likely that the free electrons tend to have higher energies. In fact, measuring the ratio between the strengths of the two lines is a good measure of the average energy of the free electrons (the “electron temperature”).
Since metals are complicated atoms/molecules with lots of electron transitions, energy can be easily radiated away through those transitions, which leads to lower electron temperatures. So if we measure low electron temperatures, this can indicate the presence of more metals.
- “Strong-line” (empirical) calibrations
Measuring electron temperatures is pretty hard, since [OIII] lines are relatively weak. So instead, you can measure the ratios of stronger emission lines; these ratios (which all have names that sound like Star Wars droids: R23, N2, D2016, O3N2) are correlated with metallicity. These correlations are empirical and not directly a physical measure like the [OIII] lines are, but they can be calibrated to match the direct method.
These calibrations are incredibly imprecise; using different ratios often gives you different metallicities. On top of that, it’s not clear if all calibrations hold in all environments. For instance, do strong-line techniques that are calibrated for low-redshift galaxies still work for high-redshift galaxies? No one’s really sure.
- Codes
Finally, you can use computational techniques to measure metallicities using multiple different lines. One such code is the HII-CHI-mistry code, which uses multiple strong-line intensities and ratios to calculate oxygen abundances.
Out in the cold
The authors of today’s paper use all three of the above methods to produce metallicity maps for two different dwarf galaxies; one example of these maps is shown in Figure 2.
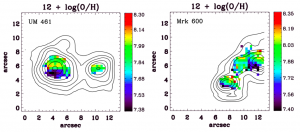
Figure 2. Metallicity maps for UM 461 (left) and Mrk 600 (right). (Units are given in 12 + log(O/H), which is the oxygen-to-hydrogen abundance relative to solar abundance.)
Using the metallicity maps, Lagos et al. find that Mrk 600 is more or less well-mixed; it has similar metallicities throughout the entire galaxy. However, UM 461 has a low-metallicity region. Based on the kinematics of the gas in this region, it looks like this metal-poor gas is being accreted onto the galaxy.
Where might this metal-poor gas come from? It’s thought that large-scale structure exists even between galaxies; filaments of metal-poor gas connect all galaxies in a cosmic web (Figure 3). Some of this gas can be accreted onto galaxies in a process called “cold flows.” We think these cold flows are necessary to produce the stars we see in many galaxies, but until recently, there hasn’t been much direct observational evidence of these cold flows.
Today’s paper may also provide additional evidence for accretion from the cosmic web, which suggests that galaxies are not nearly as isolated as the phrase “island universes” might suggest. With modern techniques (like IFU spectroscopy and metallicity diagnostics), we can better understand how galaxies are linked with each other and with their environments.
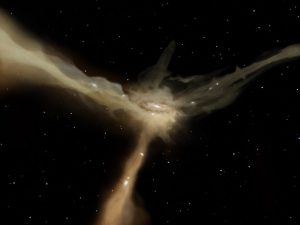
Figure 3. Image of cold flows from cosmological simulations. (Credit: ESA–AOES Medialab)

Trackbacks/Pingbacks