Title: Precision Light Curves from TESS Full-Frame Images: A Difference Imaging Approach
Authors: Ryan J. Oelkers and Keivan G. Stassun
First Author’s Institution: Vanderbilt University
Status: Open access on arxiv
Disclaimer: The first author of this paper was my supervisor during an REU, and while I was briefly involved with TESS as an undergraduate I did not participate in this work.
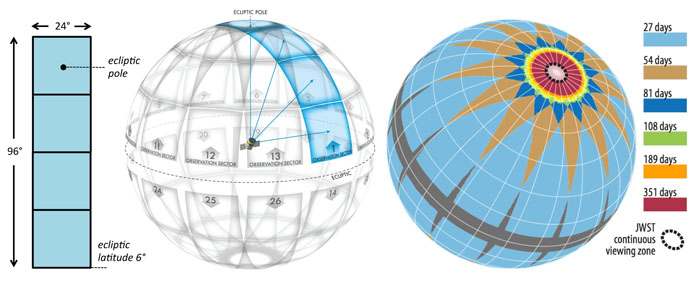
Figure 1. (left) Field of view of the four TESS cameras. (middle) The twenty-six observation sectors TESS will cover across the northern and southern hemispheres of the sky. (right) The duration for which TESS will observe different parts of the sky, with the James Webb Space Telescope (JWST) continuous viewing zone. [Source: https://tess.gsfc.nasa.gov/science.html]
The Transiting Exoplanet Survey Satellite (TESS) will be launching very soon (in about a month according to NASA’s launch countdown clock), and it promises to yield exciting results with a near all-sky survey for exoplanets around bright, nearby stars. Over two years, TESS will observe over 400 million stars by systematically scanning sectors of the sky for 27 days at a time (see Figure 1). About 400,000 of these stars will be studied closely, and will have light curves associated with them in data releases. The rest of the stars can be studied through full-frame images (FFIs), which have a 30-minute cadence and consist of TESS’s entire field of view. To clarify, this doesn’t mean that an observation is taken every thirty minutes. The TESS cameras take images every two seconds. To save on storage and transmission time those images are stacked to create new images with an effective exposure time of thirty minutes.
Because TESS is designed to conduct a wide survey, its pixels span a large part of the sky — 21 arcseconds per pixel to be exact. For comparison, the Wide Field Camera 3 on the Hubble Space Telescope spans 0.04 to 0.13 arcseconds per pixel depending on the detector. The large arcsecond per pixel scale means that the stars in TESS FFIs are more likely to be distorted and blurred into each other, making it difficult to measure changes in brightness (see Figure 2). How can one get around this? The authors of this paper offer up an image processing pipeline that does the trick.
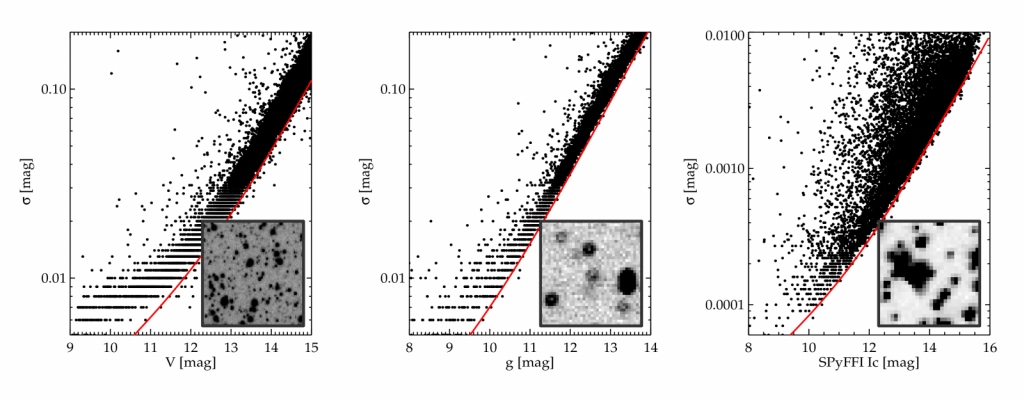
Figure 2. Comparing the pipeline’s output for three different data sets with different arcsec/pixel scales. The x-axis records magnitude and the y-axis records the deviation from the average magnitude of a given object. The inset images show how stars appear in the typical image from that data set. From left to right, the scales are 6.4”/pix, 15”/pix, 21”/pix (TESS). [from Figure 1 in paper]
Stack, subtract, extract
One way to measure how an object’s brightness changes is to count the number of photons it emits over time. This is easy to do when a star is in a sparsely-populated part of an image; it’s safe to assume that any light from that part of the image is coming from the star. In crowded fields, things get complicated. Stars can appear to overlap, making it difficult to tell where the light is coming from.
A way around this is Difference Imaging Analysis (DIA). To do this, you need at least two images of the same part of the sky. Usually, one has a higher signal-to-noise ratio (SNR) than the other. Blur the image with the higher SNR to match the image with the lower SNR, and subtract one from the other. This should eliminate any objects that have a constant brightness and leave behind, you guessed it, the objects that do change brightness!
To determine a DIA approach to TESS FFIs, the authors used NASA’s “End-to-End 6” (ETE-6) simulated FFIs for TESS. To create the higher SNR image, all 1,348 ETE-6 images were aligned and stacked to create a master frame. Aside from creating a frame to subtract from, stacking several images also ensures that transient objects like asteroids are removed from the master image. To be sure that subtraction had occurred properly, the authors checked the distribution of the values of background pixels in the differenced image. If only variable objects were left behind, then the rest of the pixels ought to be around zero. This is indeed the case with the differenced images that are produced (see Figure 3).
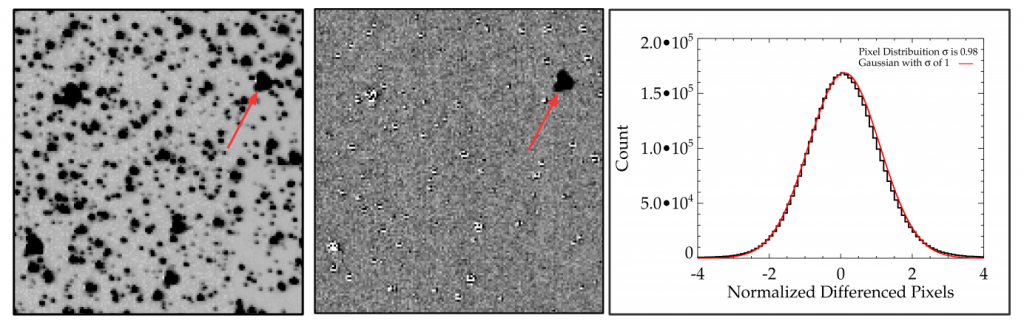
Figure 3. (left) A typical science image with the colors inverted and an arrow pointing towards a candidate variable object. (middle) The differenced image with an arrow still pointing at the much more distinct variable object. (right) The distribution of background pixel values from the differenced image. The distribution follows a Gaussian centered at zero, which means that the subtraction occurred properly. [Figure 3 in paper]
Through the light curves, and what the pipeline found there
The exact number of variable events (transits and variable stars) injected into the simulated images is unknown but there should be several hundred of each type. The authors recovered 2,275 stars that showed variability (see Figure 4), which is good news for the pipeline. With their current resources, the authors estimate that they should be able to extract light curves from TESS FFIs a few weeks after data releases. The pipeline is publicly available and can be adapted for other data sets.
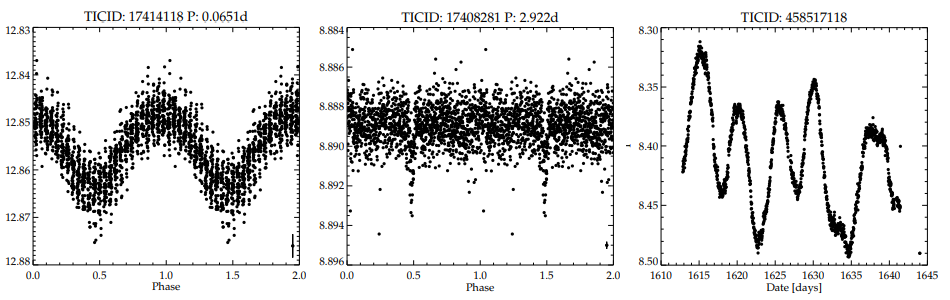 Figure 4. Examples of the variable object light curves extracted from the ETE-6 FFIs. (left) Likely simulated periodic variable star. (middle) Likely simulated transit or binary candidate. (right) Simulated large amplitude variable star. [from Figure 4 in paper]
All in all, it seems that TESS is going to uncover loads of interesting objects. It’s expected to recover approximately 1700 planets from its target stars—including 70 or so Earth-like planets—and variable objects by the thousands from its FFIs. And DIA will definitely make a difference.
Author
Trackbacks/Pingbacks