Title: A reevaluation of the proposed spin-down of the white dwarf pulsar in AR Scorpii
Authors: S. B. Potter & D. A. H. Buckley
First Author’s Institution: South African Astronomical Observatory, Cape Town, South Africa
Status: Accepted for publication in MNRAS Letters [open access on arXiv]
This is our astrobite! Thank you for your support over the years.
Two years ago, the first white dwarf pulsar was discovered by scientists at the South African Astronomical Observatory. The white dwarf in AR Scorpii — a binary system also containing an M-type main sequence star — was found to exhibit regular, extremely strong pulsations. The periodic emission from the white dwarf (henceforth, AR Sco) spans almost the entire electromagnetic spectrum, despite the fact that white dwarfs are almost never detected in far-infrared or radio light. Pulsations can cause the system’s optical flux to increase by a factor of four in less than a minute, and show extreme linear polarization of up to 40%. For these reasons, AR Sco was dubbed the first white dwarf pulsar, owing to its similarity to the rapidly rotating, highly magnetized neutron stars we know and love.
Today’s astrobite revisits a specific feature of AR Sco that was reported in Marsh et al.’s original 2016 paper: its reported spin-down rate of . Energy loss from a spinning dipole (like a pulsar; see Section 6.1.5 here) is proportional to the object’s moment of inertia times its spin frequency times the rate at which its spin is slowing (its spin-down rate). While the moment of inertia can be derived from known properties of white dwarfs, accurate measurements of the spin frequency and spin-down rate are critical in understanding the star’s properties. For example, measuring energy loss can help us understand the source of the system’s luminosity, which would shed light on how it evolved. The authors of today’s paper present two years of new observations that contradict AR Sco’s originally reported spin-down rate; in fact, the new observations yield a value consistent with zero (the “constant frequency solution”). The authors emphasize that more observations are necessary to determine the actual energy loss of AR Sco, though their new observations have allowed for a better understanding of the system.
Observations of AR Sco reveal pulses at three different periods. The first occurs every 3.56 hours, and represents the binary orbital period of the white dwarf and main sequence star system. The second of these signals is seen every 117 seconds at the white dwarf spin period. The third is every 118 seconds at the so-called “beat” frequency (which occurs due to the superposition of orbital and rotational pulsations). Figure 1 shows the three distinct pulsation frequencies over the course of an 8-hour observation; this was among the authors’ more than 60 hours of optical observations obtained using the South African Astronomical Observatory’s 1.9-m telescope.
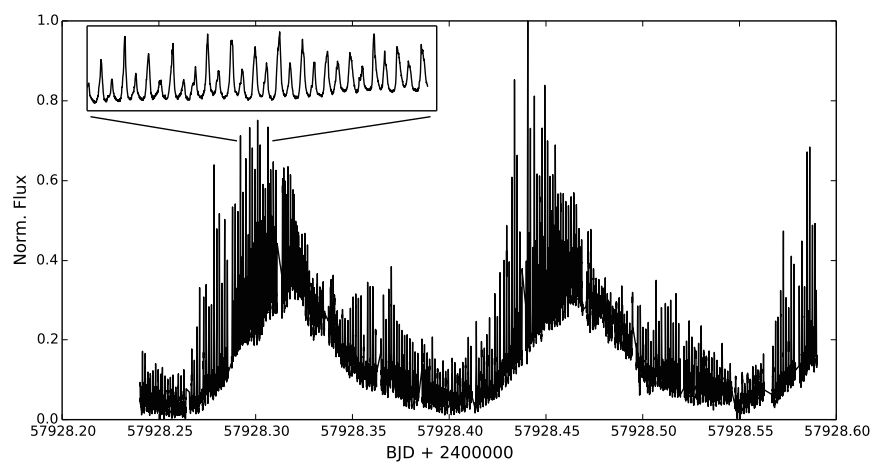
Figure 1. An 8-hour, June 2017 observation of AR Sco showing the 3.56-hour orbital variations and the shorter spin and beat fluctuations (inset). Figure 1 in the paper.
The scientists employed Fourier analysis to evaluate their observations. Fourier techniques, in short, deal with splitting signals into constituent frequencies to determine the dominant frequencies that comprise the observed signal. For data that are periodic in nature (pulsars are a great example), Fourier analysis is an invaluable tool. Figure 2a shows amplitude spectra — the results of Fourier transforms that plot amplitude against frequency — from the authors’ photometric data. In that figure, is the orbital frequency and
is the white dwarf spin frequency. The left column shows spectra from the orbital and beat (
) frequencies. The right column contains spectra from around
and its integer multiples (harmonics). The green lines show what the spin and beat periods would be if the original Marsh et al. spin-down value were applied to the more recent observations, while the red and blue lines are the best-fit values according to data from today’s featured article (Potter & Buckley 2018).
Figure 2a highlights the discrepancy between Potter & Buckley and Marsh et al.’s spin-down measurements. Though they find their measured spin period ( = 0.008538220) to be in agreement with the original value, their measured spin-down rate is consistent with zero. In order to explore the range of possible period and period derivative pairings that might be equally likely as their constant-frequency solution, the authors folded their data modulo many combinations of these values (in other words, they tried to stack all of the observed pulses by folding the observations at different spin frequencies and spin-down rates). Figure 2b shows the results of this test.
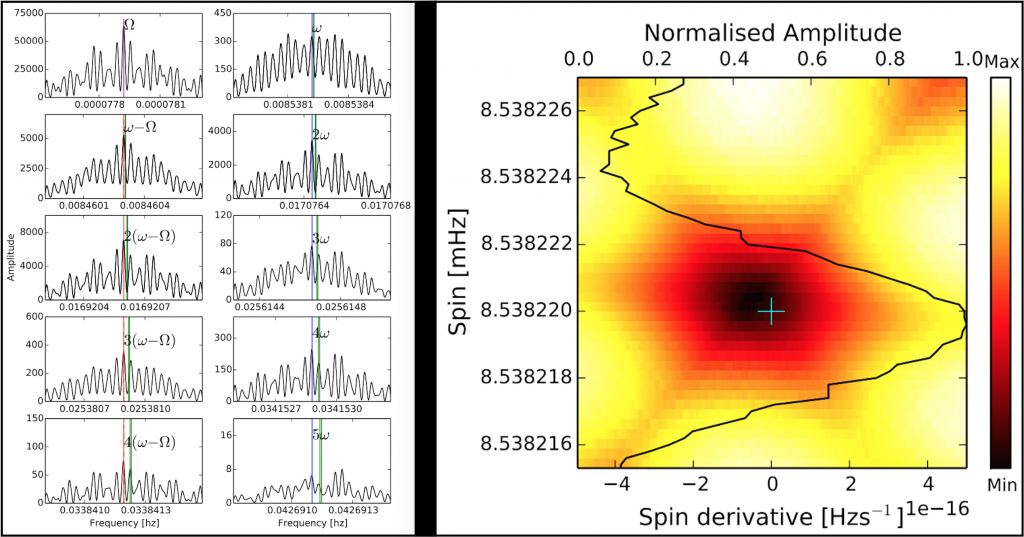
Figure 2a (left). Amplitude spectra derived from Fourier analysis of photometric observations. See text for details. Figure 4 in the paper. Figure 2b (right). Dark regions represent the best cross-correlation values for various combinations of spin frequency and derivative for AR Sco. The blue cross represents the authors’ constant-frequency solution, while other combinations in the dark spot are equally likely. Figure 7 in the paper.
The authors conclude by restating the results of the test shown in Figure 2b: that any spin-down rate between and
is currently indistinguishable as being the correct solution. In order to nail down the true spin-down rate, a much longer set of observations will be necessary (“more observations are needed” — sound familiar?). When those are finally obtained, scientists will be able to make inferences about the energetics of AR Sco that may help shed light on the strange system’s physics and evolutionary history. Until then, it’s impossible to know how quickly this bizarre white dwarf is losing energy. When we’re able to glean that information, we’ll better understand why AR Sco evolved to have the characteristics we observe today.

Trackbacks/Pingbacks