Title: Stochastic modelling of star-formation histories I: the scatter of the star-forming main sequence
Authors: Neven Caplar & Sandro Tacchella
First Author’s Institution: Department of Astrophysical Sciences, Princeton University
Status: Submitted to MNRAS, open access on Arxiv
For over a century astronomers have continued to identify fainter and more distant galaxies. In the years since Hubble’s landmark illustration of galaxy types with his eponymous “tuning fork”, incredible progress has been made in understanding the demographics and evolution of galaxies. This is due in large part to the wealth of multi-wavelength observations made possible by incredibly deep surveys, analyzed in concert with high-resolution galaxy simulations. A consensus has slowly emerged: most galaxies live in one of two populations, and evolve from one to the other primarily by ceasing their star-formation.
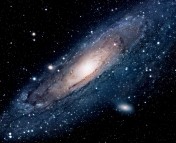
Late-type galaxies exhibit blue colors, owing to the bright O and B stars from their ongoing star-formation, and disc-like spiral morphologies. Meanwhile, Early-type galaxies exhibit red colors, a result the dominating older stellar population, elliptical morphologies, and are typically more massive. Since galaxies displaying mixtures of these properties are incredibly rare, the properties of color, stellar populations, and morphologies must be extensively correlated.

Figure 1. Late type galaxies (left) show blue colors, young stars, and spiral morphology. Early-type galaxies (right) show red colors, old stars, and elliptical morphologies. Images from NASA/ESA/HST; ESO.
A color-magnitude diagram is shown in Figure 2, but with galaxies instead of stars. The two populations are distinctly separated. But this shouldn’t be a surprise. Color is essentially a tracer of stellar population, directly related to the star-formation rate. On the other hand, absolute magnitude traces the number of stars, or similarly the total stellar mass. This relation was eventually made more readily understood by translating the astronomical parameters of color and magnitude into astrophysical parameters of star-formation rate and stellar mass. In this later parameter space, Late-type galaxies with their high star-formation rate sit at the top left and typically more massive Early-type galaxies sit below and to the right.
One of the most important results in the last two decades is that for star-forming galaxies, stellar mass correlates strongly with increased star-formation rate. This relation is known as the star-forming main sequence. Its slope is non-zero because stellar mass increases primarily through star-formation. In addition, the main sequence behaves differently at earlier times in the Universe, and features significant scatter above and below its ridge-line, as shown in Figure 2. Since this scatter in star-formation rates appears to be intrinsic, there must be some additional phenomena contributing to this observed variation.

Figure 2. The color magnitude diagram for galaxies (left) and the star-formation rate – stellar mass diagram (right). Late type-galaxies belong to the population show in blue, and Early-type galaxies in red. The star-forming main sequence is highlighted by the blue dashed line. Adapted from Baldry et al. (2004) and Bluck et al. (2016), respectively.
The particular position of a single galaxy relative to the main sequence should be dictated by its recent star-formation history. A star-formation history examines the star-formation rate as a function of time, and has been typically treated on billion-year timescales as a smooth function. If the recent star-formation is particularly strong, then the galaxy moves above the main sequence, and vice versa. Thus we need to look more closely at the detailed star-formation rates resolved on million-year timescales to investigate the scatter of the star-forming main sequence.
Over these short timescales, star-formation histories are thought to be highly variable. This is because as galaxies undergo bursts of star-formation, they use up their gas supply. Accretion from the environment may replenish the gas supply, and hence drive up star-formation. However, energy from supernovae explosions and supermassive black holes may drive down star-formation by warming gas beyond the point which it can collapse to form stars, or eject the gas entirely. Such star-formation histories are said to be stochastic, or acting in seemingly random behavior, due to a combination of phenomena which may include gas accretion and feedback events.
Featured in today’s Astrobite, the Caplar & Tacchella present the first paper in a series which proposes a single underlying model to generate stochastic star-formation histories in order to elucidate the nature of the intrinsic scatter in the main-sequence of star-formation.
The authors propose constructing these stochastic star-formation histories by defining the relative contributions of different frequencies, which correspond to different physical phenomena operating over characteristic timescales. We can understand this construction as a Fourier transform from the frequency-domain to the time-domain, just like a Fourier Transform. On one hand if there is a strong contribution from large frequencies, the star-formation history will be highly variable over very short timescales. On the other hand, domination by smaller frequencies will produce a more slowly varying star-formation history.
The model they propose is a power spectral density or PSD. The PSD describes the relative importance of the large and small frequencies, and for this application is chosen to be of the general form of a so-called ‘broken power law’, which begins at a shallow slope and then breaks at some characteristic frequency tau, falling off with a relatively steeper slope until it reaches a frequency beyond which there is no contribution.
The relation between the star-formation history and the PSD that produces it is shown in Figure 3. Individual trial PSDs are derived by adding extra random noise to the analytic PSD given by tau and a. Frequencies below the break at tau have similar contributions to the star-formation history, and beyond the break the galaxy may change its star-formation rate rapidly. If the slope a is shallow with a small break timescale, then the resulting star-formation history oscillates quickly. Meanwhile, the opposite is true for large a values (i.e. steep slopes) with large break timescales, resulting in more slowly varying star-formation rates.

Figure 3. The evolution of the scatter about the main sequence (left) as governed by the power spectrum density (right). From top to bottom, it is evident how exactly the behavior of the scatter with time is governed by the relative contributions of long and short duration events, as described by the power spectrum density with slope a and break timescale tau (red vertical line). Adapted from Figure 2 of the paper.
The key here is that the width of the intrinsic scatter of the main sequence should provide constraints on the amplitudes of the star-formation histories. This in turn constrains the PSD parameters and provides insight as to the underlying phenomena. Using data from over 9000 galaxies, the authors were able to constrain the shape of the PSD which best describes the intrinsic scatter of the star-forming main sequence!
This being said, the spread above and below the main-sequence is highly dependent on the time-resolution of the star-formation histories. Worse resolution results in smearing over the sharp peaks, resulting in a smoother star-formation history. The problem manifests observationally too as different tracers of star-formation probe different timescales. Constructing a main sequence with a tracer which probes a wide range of stellar types will result in a less stochastic the star-formation histories and hence a tighter main sequence.
Despite these difficulties, this study has laid the groundwork for a new line of investigation which may provide insight into the very core of galaxy evolution. The authors expect to develop this model further by investigating it in the context of galaxy simulations, and will describe these results in an up-and-coming paper.


