The excitement of real-time public alerts in multi-messenger astrophysics
Title: Neutron Stars Versus Black Holes: Probing The Mass Gap With LIGO/VIRGO
Authors: Tyson B. Littenberg, Benjamin Farr, Scott Coughlin, Vicky Kalogera, Daniel E. Holz
First Author’s Institution: NASA Marshall Space Flight Center: Huntsville, Al, US
Status: Published in The Astrophysical Journal Letters [open access]
Rrrring Rrrring…. It’s the universe calling!
The Laser Interferometer Gravitational-wave Observatory (LIGO) and its European counterpart, Virgo, have started issuing joint open public alerts to those who sign up whenever they pick up a cosmic whisper of these ripples in spacetime. In the wee hours of September 24, 2019, many cosmic enthusiasts who had subscribed, including me, were woken up by a new gravitational wave detection.
I’m someone who enjoys a sound sleep more than anything else, but I never complain when the universe calls—and this particular alert was especially worth waking up for. Not only had LIGO-Virgo made a new detection, but I could immediately see what kind of event had triggered this blast of gravitational waves. It was almost certainly a collision between two objects in a mysterious gray area known as the “mass gap.” (Figure 1)
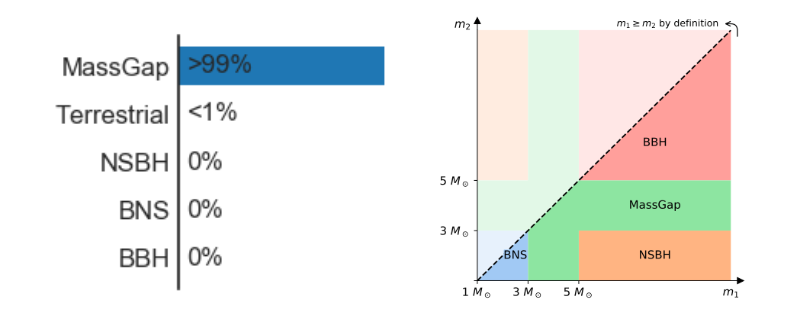
I could know all of this because, in addition to sending notices within minutes of a detection, LIGO-Virgo release the probability of whether the source is astrophysical in origin or caused due to terrestrial noise. If astrophysical, they indicate if it’s likely to be a collision between a pair of Binary Black Holes (BBH), a pair of Binary Neutron stars (BNS), or between a neutron star and a black hole (NSBH). However, the recent signal showed a greater than 99% probability of falling in the apparent void between the three categories: the mass gap.
What is the Mass Gap?
Neutron stars and black holes are collectively termed ‘compact objects’ – stars which can weigh just as much or many times the mass of the sun but are only as big as a large city. They are formed when very massive stars (more than about 8 times heavier than the Sun) burn up their fuel completely.
Ordinarily, the outward pressure generated by nuclear fusion that makes stars radiate balances the inward pull of their own gravity. As a result, when the fuel runs out, gravity wins the tussle and they collapse in a supernova explosion. The fate of the remnant core object rests on how much it weighs at the end. The heavier ones tend to collapse all the way to form black holes, while the lighter ones form neutron stars.
But things get fuzzy at this point: we can’t say precisely where the line between “lighter” and “heavier” falls. Theoretically, the heaviest a neutron star can be is about three times the mass of the sun—but we’ve never been able to adequately test that theory with observations. The heaviest neutron star ever observed, weighing in at about 2.14 solar masses, was announced recently in the journal Nature Astronomy. And the lightest black holes we’ve seen weigh around five solar masses. We’ve never seen anything in the space between three and five—a range we call the mass gap.
If the mass gap is real—if there’s truly nothing to be found in that range—it will force theorists to go back to their blackboards to review their ideas of the physics of supernovae. If there is no gap, and there is actually a sharp dividing line, we need to figure out why we haven’t seen objects in that intermediate range.
Gravitational Waves to the rescue
That is why all eyes, including mine, immediately focused on the September alert. The pattern of gravitational waves emitted when pairs of compact objects revolve around one another gives us a totally new method of estimating the mass of each body. If a mass-gap object underwent such a collision with another compact object, LIGO-Virgo will catch the distinctive ripples that emerge.
Researchers at LIGO-Virgo will now be hard at work churning data analysis codes to confirm whether the most recent event detected on September 24th really contains an object that fits into the existing void. Whatever the outcome, the current observing run surely encapsulates the excitement of cutting-edge research keeping scientists on their toes. Even better, they are sharing it with us. Keep an eye on your phone, LIGO-Virgo can make it buzz with a message from the universe at any moment!
You can subscribe to open public alerts by LIGO-Virgo at https://emfollow.docs.ligo.org/userguide/
They are also accessible from an iOS app: https://apps.apple.com/us/app/chirp-gravitational-wave-app/id1484328193
Information about all alerts is shared on LIGO social media handles.
Bonus: What else can you learn from the open alerts?
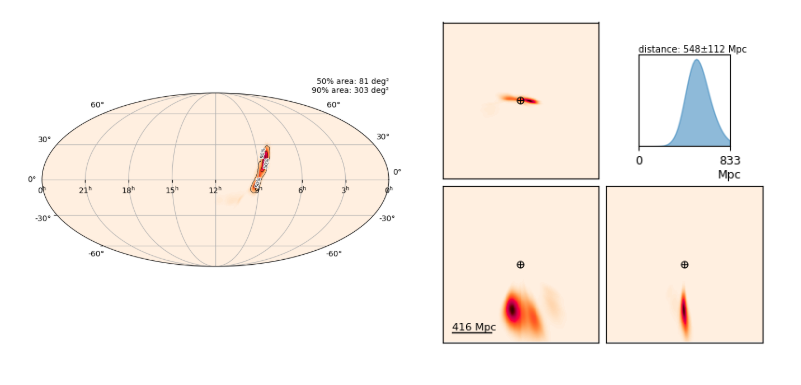
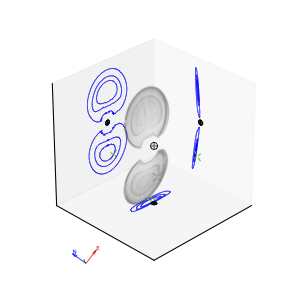
LIGO/VIRGO open public alerts are posted on the Gravitational-Wave Candidate Event Database (GraceDB) webpage. Here, in addition to learning about what kind of event LIGO and Virgo overheard, you can also find out other astrophysically interesting information for all events. This includes the False Alarm Rate (FAR), a measure of confidence giving how likely that event could have been triggered by spurious noise, in other words, a false positive. Some recent events have had a FAR of one false positive per a duration of time greater than the age of the universe, making them true astrophysical events beyond any doubt. You can also find skymaps giving the probable source location in the sky, as well as a probability distribution giving its distance away from us (Figure 2). These are incredibly helpful to identify probable host galaxies for a source and doing follow-up studies using electromagnetic telescopes.