Authors: Anshu Gupta, Kim-Vy Tran, Jonathan Cohn, Leo Y. Alcorn, Tiantian Yuan, Vicente Rodriguez-Gomez, Anishya Harshan, Ben Forrest, Lisa J. Kewley, Karl Glazebrook, Caroline M. Straatman, Glenn G. Kacprzak, Themiya Nanayakkara, Ivo Labbe, Casey Papovich, and Michael Cowley
First Author’s Institution: School of Physics, University of New South Wales, Sydney, NSW 2052, Australia
Status: Accepted to ApJ
How, exactly, galaxies form is still a very much open question in astrophysics. It’s not like we can watch a galaxy evolve, most are about 12 billion years old, and even the youngest we’ve discovered is about 500,000 million years old.
There are two ways to work around this problem. The first is a simple matter of looking back into time. Light takes a finite amount of time to travel to us, and so the further away we look, the older that light is. So the further a galaxy is, the younger we see it. Instead of watching a single galaxy evolve over time, we can compare further (“younger”) galaxies to closer (“older”) galaxies, and interpolate what may have happened to cause any changes.
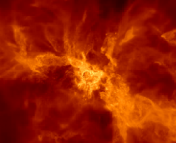
The second way to work around our observational conundrum is to watch galaxies evolve in simulation space. The authors of today’s paper used IllustrisTNG100, part of a suite of large cosmological simulations of galaxy evolution. Figure 1 shows a subset of luminous matter in the TNG100 simulation.
Observed Mass, Movement and Star Formation History
The kinematic properties (how things are moving) of star-forming galaxies is strongly linked to how they gained their mass. Today’s authors compared the velocity dispersion of “younger” galaxies at redshift z=3.0–3.8 to “older” galaxies from previous studies of redshift z~2 and found that their most massive galaxies had smaller velocity dispersions than massive “older” galaxies.
By looking at the spectra of these galaxies, today’s authors could also extract their star formation history. Basically, this looks at how old current stars are to extract the star formation rate over time. The top panels of figure 3 show the authors’ results (keep in mind, time reads as newer on the left and older on the right). The bottom two panels show results from previous studies of galaxies at z~2. While the less massive galaxies in the authors’ survey (top left panel) show the same pattern of increasing star formation rate, the most massive galaxies on the right have a relatively flat star formation history. This is in contrast to massive galaxies at z~2, which show an increasing star formation rate over time.
Both the odd star formation histories and velocity dispersions point to something happening between z=3 and z=2 that changed massive galaxies. To determine what that might be, the authors turn to simulations.
Into the Simulation
The IllustrisTNG100 simulation starts with a distribution of mass at a redshift of z=127 and runs until present day, z=0. As it runs, the random fluctuations in density at z=127 turn into galaxies, which grow, form stars and merge. The authors wanted to look at how these galaxies acquired their stars over time.
There are basically two ways that a galaxy can gain stars: either by forming them from gas belonging to the galaxy (in situ) or by accreting the stars from other, mostly smaller, galaxies (ex situ). Figure 4 shows the fraction of stellar mass that was accreted ex situ, rather than formed in the galaxy. It shows that for the most massive galaxies (in red), the fraction of ex situ stellar mass increases between z=3 (pink dotted line) and z=2 (black dotted line). Meanwhile, the ex situ stellar mass fraction remained largely constant for less massive galaxies (blue).
Uniting Simulations and Observations
The authors speculate that this increase in ex situ stellar mass fraction seen in simulations may be responsible for the increase in velocity dispersion seen in observed massive galaxies between z=3 and z=2. Turbulence and gravitational instabilities driven by accretion of stars and gas would increase the randomness of velocities (i.e. the velocity dispersion).
This could also explain the difference in star formation history between massive galaxies at z=2 and z=3 (figure 3). Gas is necessary for the formation of stars and if the galaxies at z=2 have been able to gain gas from accretion, they would be able to increase their star formation rate, as seen in the bottom right panel of figure 3. In contrast, a smaller ex situ stellar mass fraction for z=3 galaxies indicates that there has been less accretion and less opportunity to gain new gas and thus form new stars, leading to the flat star formation trend seen in the top right panel of figure 3.
Essentially, the younger galaxies at z=3 have had less time to merge with other galaxies, leading to smaller velocity dispersions and less star formation.
The authors note that their conclusions are limited by many factors, including a small sample size. However, these are promising results and show how much can be gained by comparing observations and simulations.


