Title: Differences and Similarities of Stellar Populations in LAEs and LBGs at z ~ 3.4 – 6.8
Authors: P. Arrabal Haro, J.M. Rodríguez Espinosa, C. Muñoz-Tuñón et al.
First Author’s Institution: Instituto de Astrofísica de Canarias (IAC), E-38205 La Laguna, Spain
Status: Accepted for publication in MNRAS
As we gaze deeply into the sky and push the capabilities of our observatories to their practical limits, we realize Edwin Hubble’s words: “The history of astronomy is a history of receding horizons,” (The Realm of the Nebulae). In all directions we meet a universe full of diverse galaxies that change dramatically the further we look back, and in particular, within the first few billion years after the Big Bang (Figure 1). In attempting to make sense of it all, astronomers act like cosmic archeologists and try to piece together a coherent framework which explains and connects the past.
Galaxies in the early universe are quite different from the ones we see today: they are almost ubiquitously forming stars at dramatic rates. But how exactly do they differ from each other? In today’s bite, we take a journey billions of years into the past to study star-forming galaxies during a time when the universe was a fraction of its current age.

Figure 1: Galaxies like the Milky Way look starkly different at different moments of cosmic history. Nearly all galaxies in the early universe are blue and star forming. The differences and similarities of these galaxies are crucial to understanding galaxy evolution during this time period.
Credit: NASA, ESA, P. van Dokkum (Yale University), S. Patel (Leiden University), and the 3D-HST Team.
Galaxies of Cosmic Morning
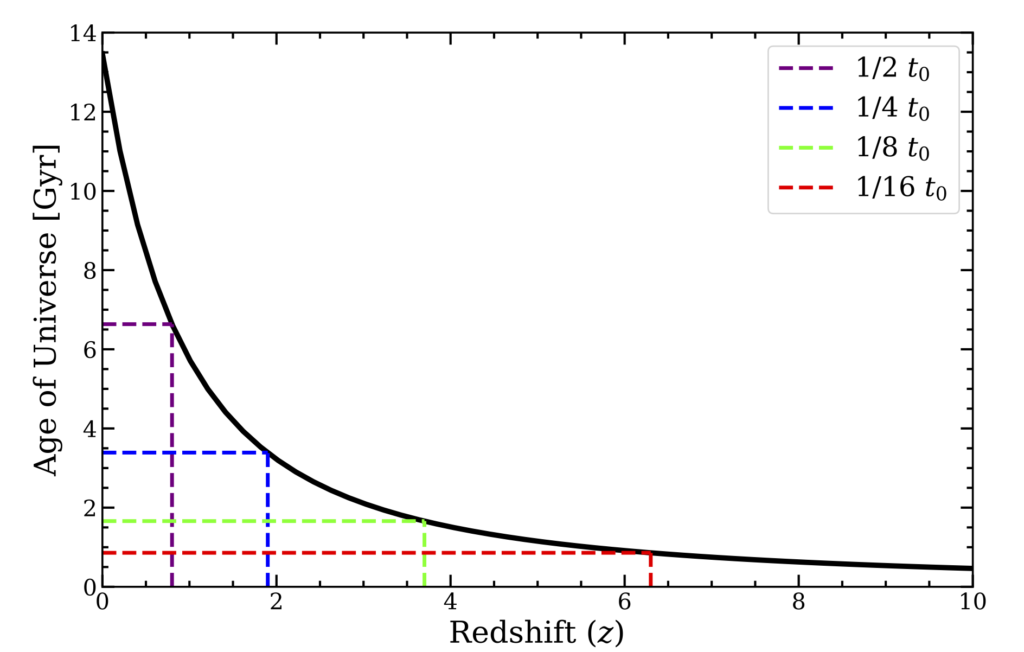
Figure 2: Conversion between redshift and age of the universe for the standard ΛCDM concordance cosmological model. Various ages of the universe are denoted as fractions of the age of the universe today (t0). Credit: Lukas Zalesky.
The work takes a close look at a population of galaxies spanning the redshifts 3.4 < z < 6.8 discovered by Arrabal Haro, the lead author, in the Great Observatories Origins Deep Survey Northern field. This famous patch of the sky was also the target of the Survey for High-z Absorption Red & Dead Sources (SHARDS), which observed this region in 25 medium-width filters in the optical and near-infrared. This unique data allowed his team to isolate a sample of ~1500 galaxies from a time when the universe was less than two billion years old (Figure 2). How?
Each of these galaxies were identified through a search for a spectral feature involving Lyman-alpha, though one subgroup involved detection of emission (Lyman-alpha emitters; LAEs) and the other absorption (Lyman break galaxies; LBGs). As Lyman-alpha emission involves the cascade of an electron in a Hydrogen atom from the n = 2 to n = 1 quantum state, it is one of the most common features in star-forming galaxies’ spectra. However, dense hydrogen clouds within galaxies can absorb nearly all of the UV emission of young stars, leaving a decrement of flux in wavelengths bluer than the Lyman limit; this spectral break is similarly common.
Essentially all high-z galaxies are star forming, and so they are almost all LAEs, LBGs, or show both features (LAE-LBGs). If we are to understand galaxy evolution in these early times, we must understand how these galaxies are alike and different.
Dissecting Distant Stellar Populations
Historically, astronomers have separated LAEs and LBGs into distinct populations of galaxies. If this distinction is physical, then the fundamental differences of these families of galaxies ought to be encoded in their spectral energy distributions (SEDs). The authors fit two primary types of models to the SEDs of these galaxies: the first model consists of a single evolving stellar population, and the other is a model consisting of two subpopulations, one young and intensely star-forming and the other old. Figure 3 shows an example of each type of model fit to the same photometric baseline.
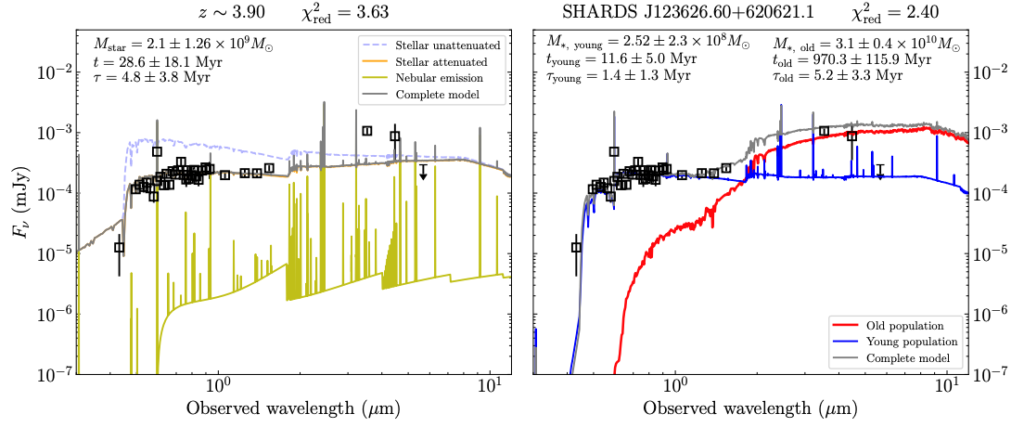
Figure 3: Example SED solutions for both a single stellar population model (left) and a double stellar population model (right) for the same LAE-LBG. Note the impressive photometric baseline probing the rest-frame UV and IR. In this case, the double population model provides a noticeably better fit to the data.
Each class of model (single vs. double stellar population) is explored with a grid of masses, ages and star formation rates. The authors evaluate the competing models in a Bayesian framework that essentially operates by a cherished principle of science: Occam’s razor. This principle states that whenever possible, the simpler model (the one with the fewest assumptions and parameters) should be preferred. However, if the simpler model really cannot describe the observations, then a more complicated model is required. Applying this principle to this analysis, the authors only accept the more complicated, double stellar population model, when it dramatically outperforms the simpler, single population model. This careful analysis is the key to drawing distinctions between the LAEs and LBGs.
Double Identity
The systematic comparison of competing model types across a grid of physical parameters allow the authors to unravel the underlying characteristics of these galaxies. As illustrated in Figure 4, the authors find that LAEs and LBGs indeed have a complicated overlap in their characteristics. On the one hand, pure LAEs (showing little or no break) tend to be younger than LBGs by tens of millions of years. Furthermore, pure LAEs tend to be significantly less massive than LBGs, with their median masses differing by an order of magnitude. One feature that is shared is the preference for both LAEs and LBGs for single stellar population models. However, both families exhibit a fraction of galaxies that require two stellar populations; these galaxies have similar ages and masses, making any serious distinction between them murky.
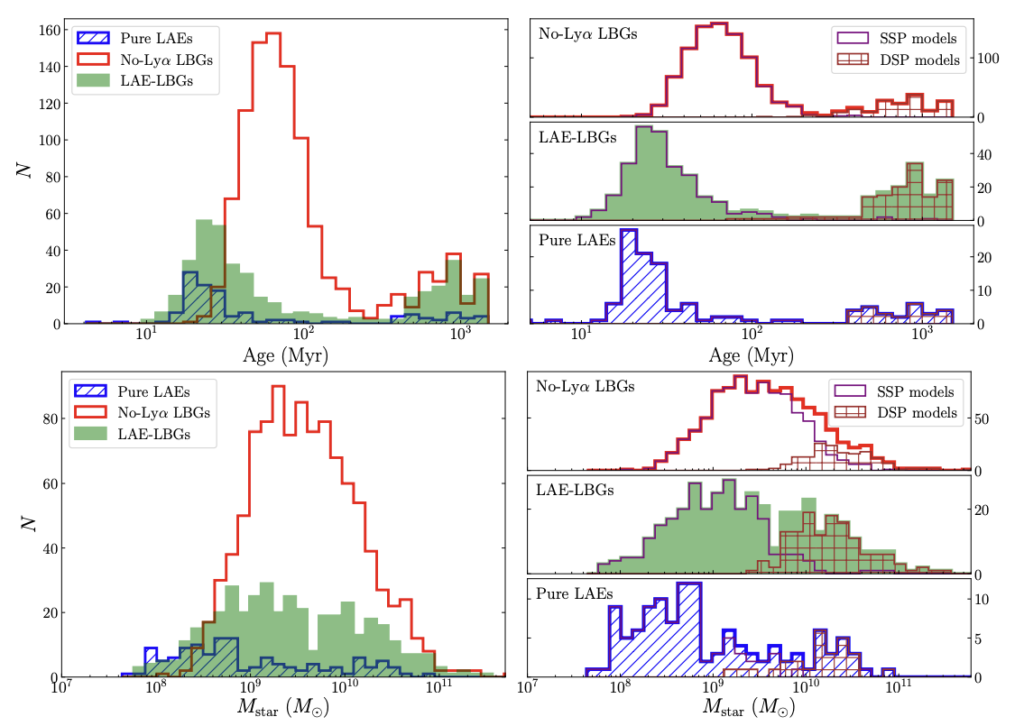
Figure 4: Top – histograms illustrating age as a function of galaxy type and preferred model (SSP = single stellar population; DSP = dual stellar population). LBGs tend to be older galaxies than LAEs, while LAE-LBGs appear somewhere in between. All DSP galaxies have similar characteristics. Bottom – histograms comparing stellar mass as a function of galaxy type and preferred model. LBGs tend to be more massive than LAEs, and again, LAE-LBGs are comparable to both.
Perhaps most telling are the characteristics of LAE-LBGs, galaxies that show both Lyman-alpha emission and a break. A third of all of these galaxies require two stellar populations, and these galaxies also appear to sit between pure LAEs and LBGs in both stellar mass and age. This suggests that LAE-LBGs might be more evolved LAEs and mark a transition between the two subtypes. Ultimately, we are left with a picture where LAEs are young galaxies undergoing their first rounds of intense star formation and LBGs are their more evolved counterparts, both in mass and age. All galaxy subtypes here are forming stars much more intensely than their low-z counterparts, but they show an analogous linear correlation between their star formation rates and stellar masses (see star formation main sequence) to the one observed in the more local universe.
In extragalactic astronomy, and especially in high-redshift studies, we will continually face the struggle described by Hubble. He said, “With increasing distance, our knowledge fades, and fades rapidly. Eventually, we reach the dim boundary – the utmost limits of our telescopes. There we measure shadows, and we search among ghostly errors of measurement for landmarks that are scarcely more substantial,” (Realm of the Nebulae). However, as we stare longer and longer into the night sky, with different facilities and tools, we shine light on these shadows and expand our horizon. As demonstrated by this work, there is still much to learn and much to explore!
Can you tell me where to find TABULATED data for high z galaxies (0.2-5.0) of distance and velocity similar to the one for red shifts less than 0.2 from u of Hawaii?
Hi Leland, thanks for your question. Such a sample does not exist for high-z galaxies. The problem is that building such a sample would require an independent measurement of each galaxy’s distance, which in general, is not obtainable for the majority of high-z sources. On the other hand, it is relatively easy to determine the distance to nearby objects, either via surface brightness fluctuations in galaxies, Cepheid variable stars, or through the “tip of the red giant branch” method (all of these are used to construct the cosmic distance ladder). For more distant sources, one of the only trusted methods is to use type 1-a supernovae. Type 1-a supernovae are a type of “standard candle,” an object of known brightness which can be used to directly infer an object’s distance. However, the most distant supernova ever observed was only at z ~ 2, though there have been a handful of more distant supernovae detections. For distant galaxies, what is commonly measured is just the redshift, and then the distance is inferred using an assumed cosmology.
Hope this helps!
Lukas
Thank you for the nice summary!
You’re welcome! Glad you enjoyed 🙂