The undergrad research series is where we feature the research that you’re doing. If you’ve missed the previous installments, you can find them under the “Undergraduate Research” category here.
Are you doing an REU this summer? Were you working on an astro research project during this past school year? If you, too, have been working on a project that you want to share, we want to hear from you! Think you’re up to the challenge of describing your research carefully and clearly to a broad audience, in only one paragraph? Then send us a summary of it!
You can share what you’re doing by clicking here and using the form provided to submit a brief (fewer than 200 words) write-up of your work. The target audience is one familiar with astrophysics but not necessarily your specific subfield, so write clearly and try to avoid jargon. Feel free to also include either a visual regarding your research or else a photo of yourself.
We look forward to hearing from you!
************
Stephen Schmidt
University of North Carolina-Chapel Hill
Stephen Schmidt is an undergraduate studying Astrophysics and Applied Mathematics at the University of North Carolina-Chapel Hill. He completed this research at UNC-CH under the supervision of Dr. Andrew Mann.
In recent years, NASA has sponsored several space missions to find exoplanets – planets that orbit other stars. Since space-based telescopes cannot spend too much time observing each individual target, we have to use telescopes on the ground to follow-up. I used Las Cumbres Observatory, a global network of telescopes, to gather data on a set of young planets and stars. I measured the brightness of each target over many images and corrected the data for atmospheric interference. Since the stars that I am interested in tend to be very red and vary in brightness a lot, I had to make sure that my code was tailored for this. With these corrections, I generated light curves of the targets. These are plots that show how the brightness of the target star changes over time. With my light curves, I observed several transits, when one object passes in front of another and blocks out some light. This causes the “flux ratio”, between the current amount of light detected and the usual amount of light the star appears to emit, to decrease and appear lower for the duration of the event (see Figure). I also used the light curves to see how some of the stars with a dusty disk around them changed in brightness over time. I presented my work this June at AAS 236.
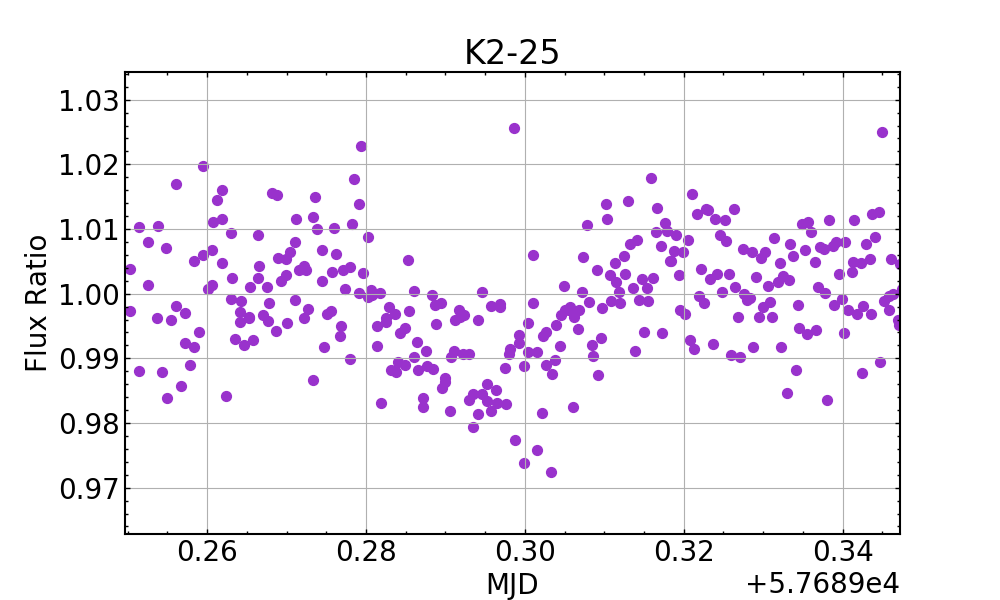
This is a light curve for a K2-25, a star with an exoplanet. The slight dip in the middle of the plot indicates that a transit has occurred.The x-axis refers to time in days, and the dip (of about 1 percent) lasts for less than an hour.
Excellent job by my great nephew!!