Title: Stellar and Molecular Gas Rotation in a Recently Quenched Massive Galaxy at z ∼ 0.7
Authors: Qiana Hunt, Rachel Bezanson, Jenny E. Greene, Justin S. Spilker, Katherine A. Suess, Mariska Kriek, Desika Narayanan, Robert Feldmann, Arjen van der Wel, and Petchara Pattarakijwanich
First Author’s Institution: Princeton University
Status: Published in Astrophysical Journal Letters, open access on arXiv
We know that as they age, galaxies transition from blue, star-forming disks to red, quiescent ellipticals, but the stages of evolution and the process of stopping star formation (often called quenching) are still mysterious. One clue to answering these questions may be post-starburst galaxies, or galaxies that recently experienced a period of intense star formation and are now calm and quiet. The authors of today’s paper explore the properties of the stars and gas in a post-starburst galaxy to explain what mechanisms may have stopped the star formation.
The Starting Line-Up
Post-starburst galaxies are generally full of A-type stars. This means their period of star formation must have stopped a few billion years ago, within the lifetime of main sequence A-type stars. The quenching mechanism for star formation (basically, whatever turns it off) is thought to leave a signature, but that signature deteriorates over time, so it is essential to look at galaxies right after their star formation stops.
SDSS J0912+1523 is a recent and unusual post-starburst galaxy. Its molecular gas mass is around 30% of the stellar mass, much higher than other similar galaxies, which makes it an interesting target. Figure 1 shows the galaxy. On the left is the flux map, which shows the brightest portions of the galaxy in green. There are two main peaks at the center of the galaxy, which might indicate that the galaxy has two cores. On the right is the galaxy separated into spatial bins, with different shaded grey regions representing different bins that will be used later. The flux contours are overlaid to again show the brightest portion, and the rightmost squiggly line shows the combination of flux and noise across the galaxy.
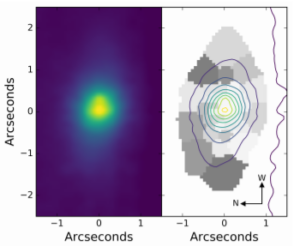
Figure 1. (left) The flux map of SDSS J0912+1523, a post-starburst galaxy. Green represents higher flux, while dark blue represents lower flux. The two central peaks in the flux represent two possible cores. (right) The galaxy sectioned into bins (differing shades of grey) with flux contours overlaid in the same colors as the left plot. The purple line on the right side shows the combination of flux and noise across the galaxy. See Figure 1(a) in the paper.
Moving As A Team
The authors of today’s paper used spectroscopy from Gemini Observatory to look at the properties of stars in the galaxy. They looked for oxygen emission lines that generally indicate star formation and found none, which is to be expected for a quenched galaxy. The authors did, however, find lots of hydrogen Balmer absorption lines because A-type stars have very strong Balmer lines in their spectra. The depth of those lines can actually be used as a proxy for stellar age. The deeper the absorption line, the more recent the star formation episode.
To quantify how deep the Balmer lines were in each spectra, the authors used an equivalent width. When an absorption line dips below the continuum, there is a certain area between the curve and the continuum. The equivalent width is how much of the continuum (in this case in Angstroms) it would take to make a rectangle with that same area underneath. The equivalent widths in the center of the galaxy can be seen in the top row of Figure 2. On the left, the figure shows the values for the equivalent width with position in the galaxy, while on the right it shows the equivalent width with distance from the center of the galaxy. The equivalent width doesn’t change much within the inner part of the galaxy, which means that all the stars are probably from a common population that formed at the same time.
The spectra were also used to find velocities and velocity dispersions, as shown in the second and third rows of Figure 2. The velocity map and trend with distance from the center of the galaxy shows that the galaxy is clearly rotating, as one side is moving away from us and one side is moving towards us. The consistency in the velocity dispersion indicates that the two cores (the two peaks in intensity that we saw above) are the same galaxy rotating as a single object. The authors suggest the two cores might be remnants of a galaxy merger or a single core with a lane of dust obscuring part of it.
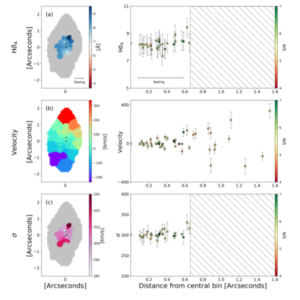
Figure 2. (row a) The first column shows the equivalent width of the hydrogen Balmer absorption line for bins in the center region of the galaxy. Larger values correspond to more recent star formation. The second column shows the equivalent width with distance from the center of the galaxy, color-coded by signal-to-noise. (row b) Velocity within binned regions of the galaxy and velocity with distance from the center. The galaxy is clearly rotating, with one side blueshifted and the other redshifted. (row c) The same as seen in the other rows, but for velocity dispersion. See Figure 2 in the paper.
Subbing In A New Player
The authors of today’s paper also compared their findings to ALMA data that shows the galaxy’s molecular gas content. Figure 3 shows the comparison of stellar (left) to molecular gas (right) velocities. The stellar velocities very closely resemble the molecular gas velocity, so the stars and gas are likely rotating together.
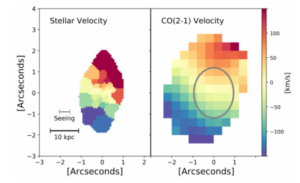
Figure 3. The velocity map for stellar velocity from this paper (the same as in Figure 2) compared to cold molecular gas in the galaxy (from ALMA data). The similarity indicates that the stars and the gas are rotating together. See Figure 4 in the paper.
Hydrating A Galaxy
So what does this information tell us about the star formation quenching mechanism? There are a lot of ideas about what might stop star formation. Galaxy mergers might heat up gas and prevent it from collapsing into stars. Gas might fall to the center of galaxies, creating star formation there but leaving an empty outer part of the galaxy, or it might get ejected altogether in an outflow. Each of these scenarios is expected to result in a certain amount of velocity dispersion and cold molecular gas. And this galaxy? Because of its large molecular gas content and stable velocity dispersion, it doesn’t fit well with any of these scenarios. Today’s authors suggest that something else might be at play– a type of quenching where the disk of a galaxy stabilizes itself from collapse, the very thing that causes star formation.
This target is a very interesting example of the transition from star-forming to quiescent galaxies. Continuing to study subjects like it will allow astronomers to determine how galaxies become red and dead.
Author