Title: Benford’s law in the GAIA universe
Authors: Jurjen de Jong, Jos de Bruijne, Joris De Ridder
First Author’s Institution: Science Support Oce, Directorate of Science, European Space Research and Technology Centre (ESA/ESTEC), The Netherlands
Status: Accepted by Astronomy and Astrophysics [open access]
When astronomers conduct a giant survey, they collect overwhelming amounts of data. Of course, this is a good thing: more data equals more information and, therefore, new insights into our universe. But how can we check whether the data is correct? Well, the authors of today’s paper try to use a mathematical curiosity generally used for detecting tax fraud: Benford’s law.
What is Benford’s law?
Benford’s law is a curious mathematical fact. It states that in a large dataset, not all numbers are equally likely to appear. 30% of the data should start with a 1, while only 5% of cases begin with a 9. Fig. 1 shows the probability for each number between 1 and 9 to be the first digit of a data point.
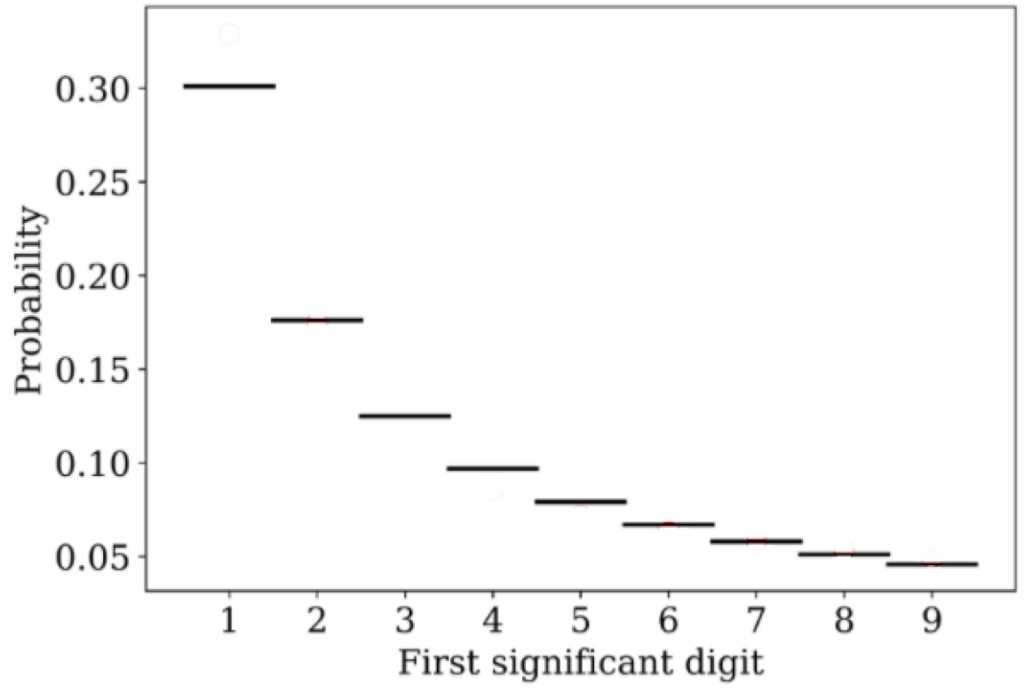
Figure 1: Probability of each number to be the first significant digit of a data set following Benford’s law. Adapted from Fig. 1 in the paper.
This law appears quite unintuitive. Nevertheless, many different datasets follow it – from the stock market to the lengths of rivers. An essential application of Benford’s law is the detection of tax fraud. When people invent numbers, they often choose every number between 1 and 9 with the same frequency – disregarding Benford’s law. Therefore, tax declarations with numbers that do not follow Benford’s law might be fraudulent. Similarly, Benford’s law was used to argue that economic data submitted by Greece to the EU before it joined the eurozone were manipulated.
There are a few prerequisites for data to follow Benford’s law. First, the data should not be truncated and span several orders of magnitude. This makes sense. Suppose all data is distributed between 5 and 8. Then Benford’s law could not be fulfilled, as the number 1 would not occur at all. Second, the data should be ‘scale-invariant’. This means that there should be no ‘important’ value around which the data cluster. For example, if most of the data has a value around 4, the digits 3, 4, and 5 will occur more often than 1. Consequently, it is not clear from the get-go that a particular dataset fulfils Benford’s law. Today’s authors study whether we can use it to check a fascinating astronomical dataset – distances to stars in our Milky Way.
What data is analysed in today’s paper?
Today’s authors study stellar distances measured by the Gaia mission. Gaia is a space observatory, shown in Fig. 2, tasked with creating the most accurate map of the stars in our Milky Way to date. It plans to map a billion objects, including mostly stars, but also planets, comets and asteroids (Learn more about Gaia in this bite).

Figure 2: Artistic rendering of the Gaia satellite. Credit: ESA/ATG medialab; background: ESO/S. Brunier
Since Gaia wants to map the Milky Way, its central observables are the positions and distances of stars. To estimate the distance to a star, Gaia measures the so-called parallax effect. Due to Earth’s orbit around the sun, we observe a star in spring under a slightly different angle than in autumn. Therefore, its apparent position on the sky shifts. This shift is called the parallax and is inversely proportional to the star’s distance. From this parallax, the distance to a star can be estimated, under correction for systematic biases and measurement uncertainties.
The authors of today’s paper check if the parallax measured by Gaia and the subsequent distance estimates follow Benford’s law. Their goal is to determine whether the data has any systematic biases that need correcting.
Do Gaia’s measurements follow Benford’s law?
The answer is a clear ‘Yes and No’. Figure 3 shows the distribution of the first digit of the Gaia parallaxes and the prediction of Benford’s law. Both distributions agree quite well, so the parallax measurement seems to follow the mathematical law.
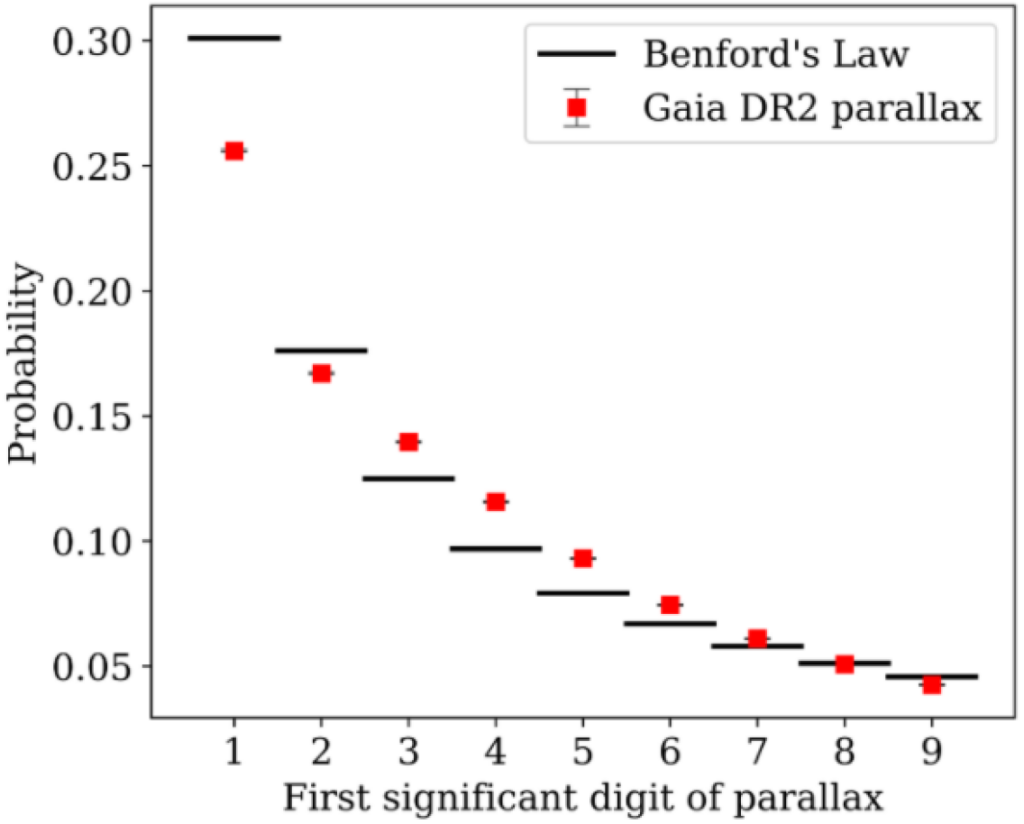
Figure 3: Frequency of each number to be the first significant digit of the parallaxes measured by Gaia (red circles) along with the expectation from Benford’s law (black lines). Figure 5 in the paper.
However, Figure 4 paints a different picture. It depicts the distribution of the first digit of the distances. This distribution has two peaks – one at 1, and another at 7. Consequently, stellar distances do not agree with Benford’s law.
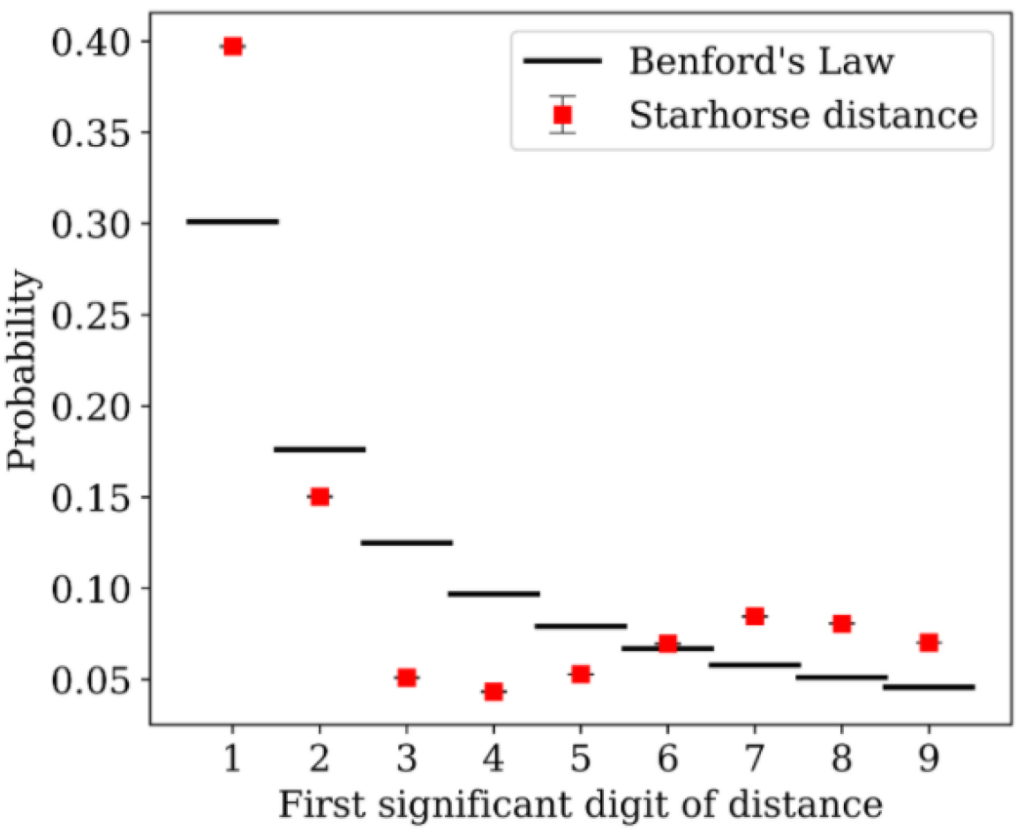
Figure 4: Frequency of each number to be the first significant digit of stellar distances measured by Gaia (red circles) along with the expectation from Benford’s law (black lines). Figure 9 in the paper.
Does this mean that the Gaia data is wrong? Do we need a new satellite?
Well, as explained above, we cannot apply Benford’s law blindly applied to any data set. In particular, there should be no “special” scale in the data. For Gaia, though, there is a specific scale: the Milky Way’s centre is situated around 8 kpc away from the Earth, so we expect many stars at distances between 7 and 8 kpc. Also, there are only a few stars with distances more than 10 kpc detected by Gaia, so the data set does not run over several orders of magnitudes. Therefore, maybe Benford’s law is not particularly well suited to this data set.
The measured parallaxes, though, span a range of four orders of magnitude – enough that Benford’s law could realistically apply. The authors also found, that increasing the uncertainty on the parallax measurements leads to a better agreement with Benford’s law. Therefore, the error bars on the parallax measurement could be the reason parallaxes follow Benford’s law.
The authors check whether stellar distances are expected to follow Benford’s law at all. For this, they consider a simulation called Gaia Universe Model Snapshot (GUMS). This simulation is a sophisticated, realistic model of the Milky Way. For the stars in the GUMS, all distances from the observer (i.e. us) are known, so the authors could directly check whether they follow Benford’s law.
Their result is shown in Fig 5. The simulation also exhibits a second peak in the distribution of first digits. The second peak is around 6, similar to the observed second peak at 7. The authors conclude that Benford’s law does not apply to stellar distance measurements. This seems like an unsatisfying conclusion, but there is one reassuring take-away from the analysis: stars and the structure of our Milky Way are more complex than tax fraudsters!
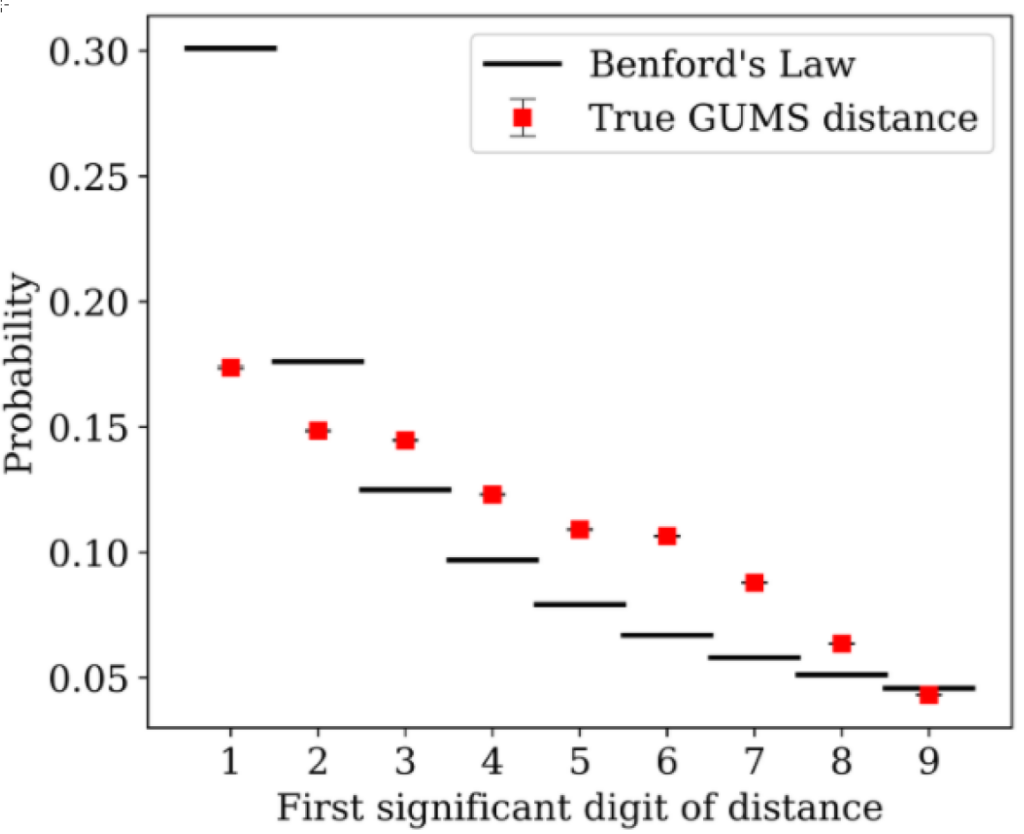
Figure 5: Frequency of each number to be the first significant digit of stellar distances in a simulation of the Milky Way (red circles) along with the expectation from Benford’s law (black lines). Figure 12 in the paper.
Astrobite edited by Ashley Piccone.
Featured image credit: ESA/ATG medialab; background: ESO/S. Brunier
Author