Paper Title: Identifying Candidate Optical Variables Using Gaia Data Release 2.
Authors: Shion Andrew, Samuel J. Swihart, and Jay Strader.
First Author’s Institution: Department of Physics, Harvey Mudd College, Claremont, CA 91711, USA.
Status: Accepted to ApJ. Open access on arXiv.
The Wonders of Gaia
1.5 million kilometers from Earth, at the L2 Lagrange point, a space observatory not much larger than a car traverses space and gazes deeply into the Milky Way. Launched in 2013, Gaia tediously constructs a three-dimensional map of our Galaxy. Its primary objective is to determine the brightness, temperature, composition, and motion of over a billion astronomical objects (mostly stars)… and I thought grad school was demanding!
Unlike many spacecraft, Gaia observes its targets frequently (~ 70 times). As a result, it offers the rare ability to expose the variability of the celestial bodies under its watchful eye. These observations provide us the opportunity to advance our understanding of stellar evolution and the dynamical nature of our Galaxy’s constituents.
Isolating Variables
Well-studied variables, such as RR Lyrae, Cepheids, and long-period variables provide high-quality measurements; however, sources with short-term variability are harder to detect and limit the number of variables that are studied. In fact, from the Gaia Data Release Two (DR2), which is the instrument’s most recent data release that contains G-band photometry measurements for ~ 1.7 billion sources, information is only provided for 550,000 variable sources. To address this dearth of variability observations, the authors conduct a thorough review of variable stars that are confirmed in DR2. They contend that variable stars can be identified by targeting stars with relatively high photometric uncertainties. If so, this method may prove critical for building a robust sample of variable stars that can be used for future studies!
In Figure 1, the authors plot Gaia G-band magnitude vs. G-band magnitude uncertainty for 1,000 stars in a small region of the sky. The patch of the sky was centered on a well-studied RR Lyrae variable star, TY Hyi (G = 14.3). The “baseline curve”, where the bulk of the stars (the black dots) lie, is the expected distribution for non-variables. Away from this curve, the variable star (the red dot) has a much larger uncertainty than the stars with a similar brightness on the baseline curve.
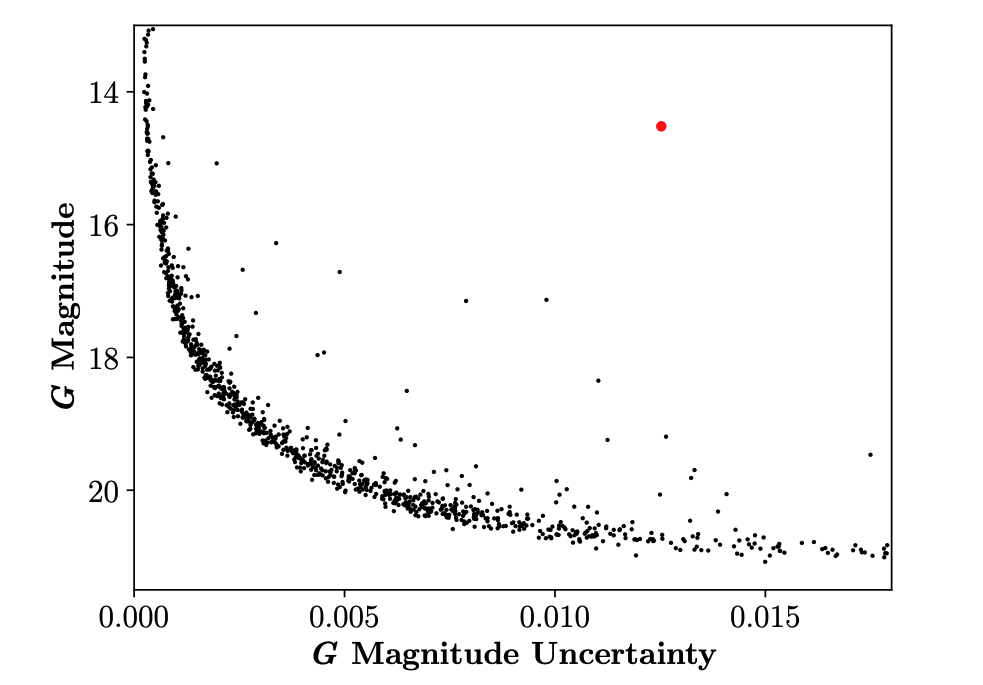
Figure 1. A G-band magnitude vs. G-band magnitude uncertainty plot of 1,000 DR2 stars showing the expected “baseline curve” along which most non-variable stars lie. The variable star (red dot) does not fall on the baseline curve, but instead has a noticeably larger G-band magnitude uncertainty than other stars of comparable magnitude. (Figure 1 in the paper)
In Figure 2, the authors expand their analysis and consider 70,680 variable stars with photometric periods < 10 days. They now also consider 2,000 random non-variable stars. In this plot, nearly all the variables lie above the baseline curve, with higher uncertainties compared to non-variable stars of similar magnitudes. Moreover, they find that stars with higher variability amplitudes feature higher uncertainties.
To note, the authors acknowledge that the G-band magnitude uncertainty varies with the number of observations (at fixed brightness, the uncertainty decreases as the number of observations increases), and correct for this by using the weighted average of individual photometry measurements for each source.
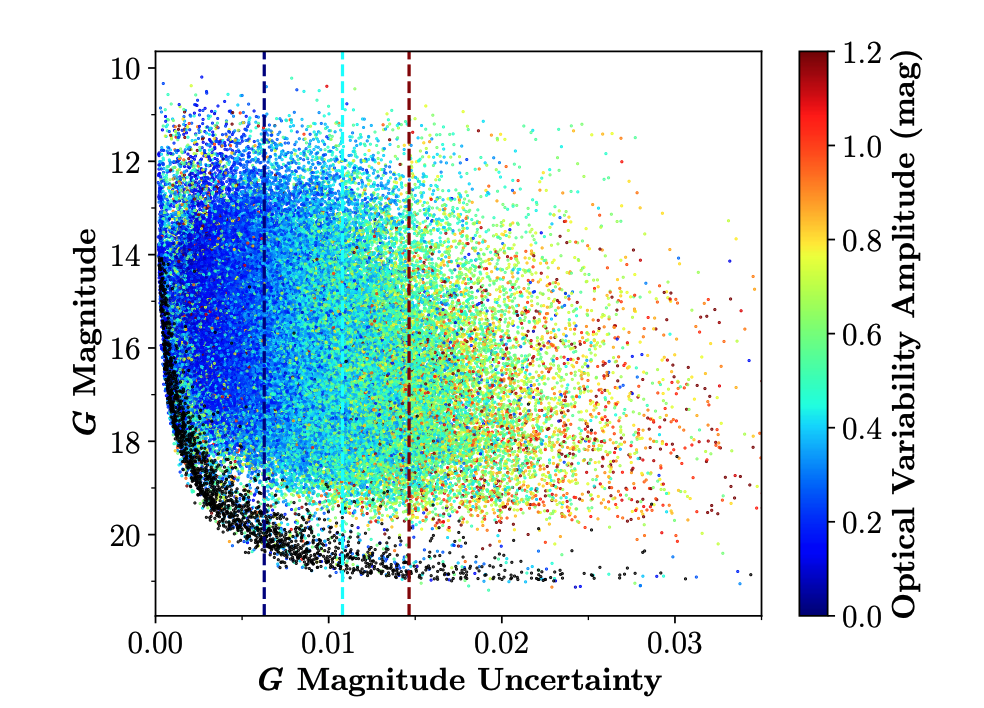
Figure 2: G-band magnitude vs. G-band magnitude uncertainty for 70,680 variable stars with periods less than 10 days, colored by their optical variability amplitude. The black points are a random sample of 2,000 stars, illustrating a baseline curve for non-variable stars. The dashed lines are the mean magnitude uncertainty of variables, in three bins from 0.0 to 1.2 mag in variability amplitude.
Exploring Other Catalogs
The authors then calculate a standard deviation, σ, from the baseline curve for sources using binned G-band magnitudes. They subsequently define a parameter, Gσ, which is the ratio of the G-band magnitude uncertainty in Gaia DR2 for a given source, to the σ for that bin. They use this parameter to define a threshold of Gσ = 3 for identifying variable stars.
But how effective is this method in finding short-period variables in Gaia’s DR2? To address this, they check the reliability of their newly defined threshold by scanning a series of short-period (<10 days) variable star catalogs with photometric G-band magnitudes between 14 and 19.5. They first inspect the Catalina Real-Time Transient Survey, which contains 70,680 variables. From their analysis, they find that 96% of the variables in this catalog have Gσ values > 3; the remaining 4% were masked because of potential contamination by a nearby neighboring star, which can generate false positives. Moreover, they inspect the Zwicky variable star catalog (see here for more on the Zwicky Transient Facility), which contains 556,521 variables. Similarly, they find a significant percentage (94%) are recovered when applying the Gσ > 3 threshold; the remaining 6% are also excluded because of neighboring stars.
Furthermore, this method also proves effective at identifying standard RR Lyrae and Cepheid variables (which can have periods up to 70 days). From Gaia DR2, they find that 100% of the Cepheids (8,465 sources) and 99.8% of RR Lyrae (107,418 sources) have Gσ > 3.
Confident in their method, they proceed to analyze the entirety of DR2 and catalog 9.3 million candidate variable stars, a significant increase from the 550,000 sources reported in DR2 prior to this study.
Hidden No More
The authors of today’s paper provide an immensely powerful tool for identifying variable stars. They show that variable stars in Gaia’s latest data release, which contains over 1.7 billion sources, tend to have larger photometric uncertainties when compared to non-variable stars; more variable stars have larger photometric uncertainties, too. They quantify this relation with the parameter Gσ, which traces how far a star is from a baseline curve of non-variable stars. Using a threshold of Gσ = 3, they recover over 90% of short-period variables in other variable catalogs.
Variable stars have significantly contributed to some of the largest advances in modern astronomy: they have helped us define cosmological parameters, enhanced our understanding of the distance-scale of the universe, and provided us the information to calculate the ages of the oldest stars. Accurately identifying, and studying, these objects promise to unveil even more about our universe. Fascinating instruments like Gaia will serve as the bridges to these wonderful discoveries.
Image Credit: NASA, ESA, and the Hubble Heritage Team (STScI/AURA)-Hubble/Europe Collaboration; Acknowledgment: H. Bond (STScI and Penn State University)
Editor: Ellis Avallone