Title: Disentangled Representation Learning for Astronomical Chemical Tagging
Authors: Damien de Mijolla, Melissa Ness, Serena Viti, Adam Wheeler
First Author’s Institution: Department of Physics and Astronomy, University College London
Status: Accepted to the Astrophysical Journal
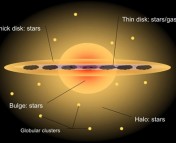
The question of galaxy formation and evolution is a big one in astronomy, and the Milky Way is a convenient test bed for studying this question. The Milky Way is composed largely of stars, gas, dust, and dark matter, and all of these components can be studied individually and collectively to inform our understanding of how galaxies form and evolve. Galactic archaeology is a subfield of astronomy that treats individual stars as ‘fossils,’ using them as tools to study the evolution of our Galaxy. The kinematic and chemical properties of a star hint at its ancestry. A star’s position in and motion through our Galaxy, for example, can tell us in what portion of the Galaxy it was born (e.g. thick disk, thin disk, halo, or bulge), whether it is a member of a certain cluster of stars, or whether it was part of a stellar population that was accreted by the Milky Way. The chemical composition of a star also contains a plethora of information about its history, and the use of stellar chemistry to infer a star’s origins is called chemical tagging. Today’s authors develop a new way to practice chemical tagging using a neural network that “disentangles” stellar spectra to bypass the precision issues often faced by chemical taggers. But first, let’s start with some background!
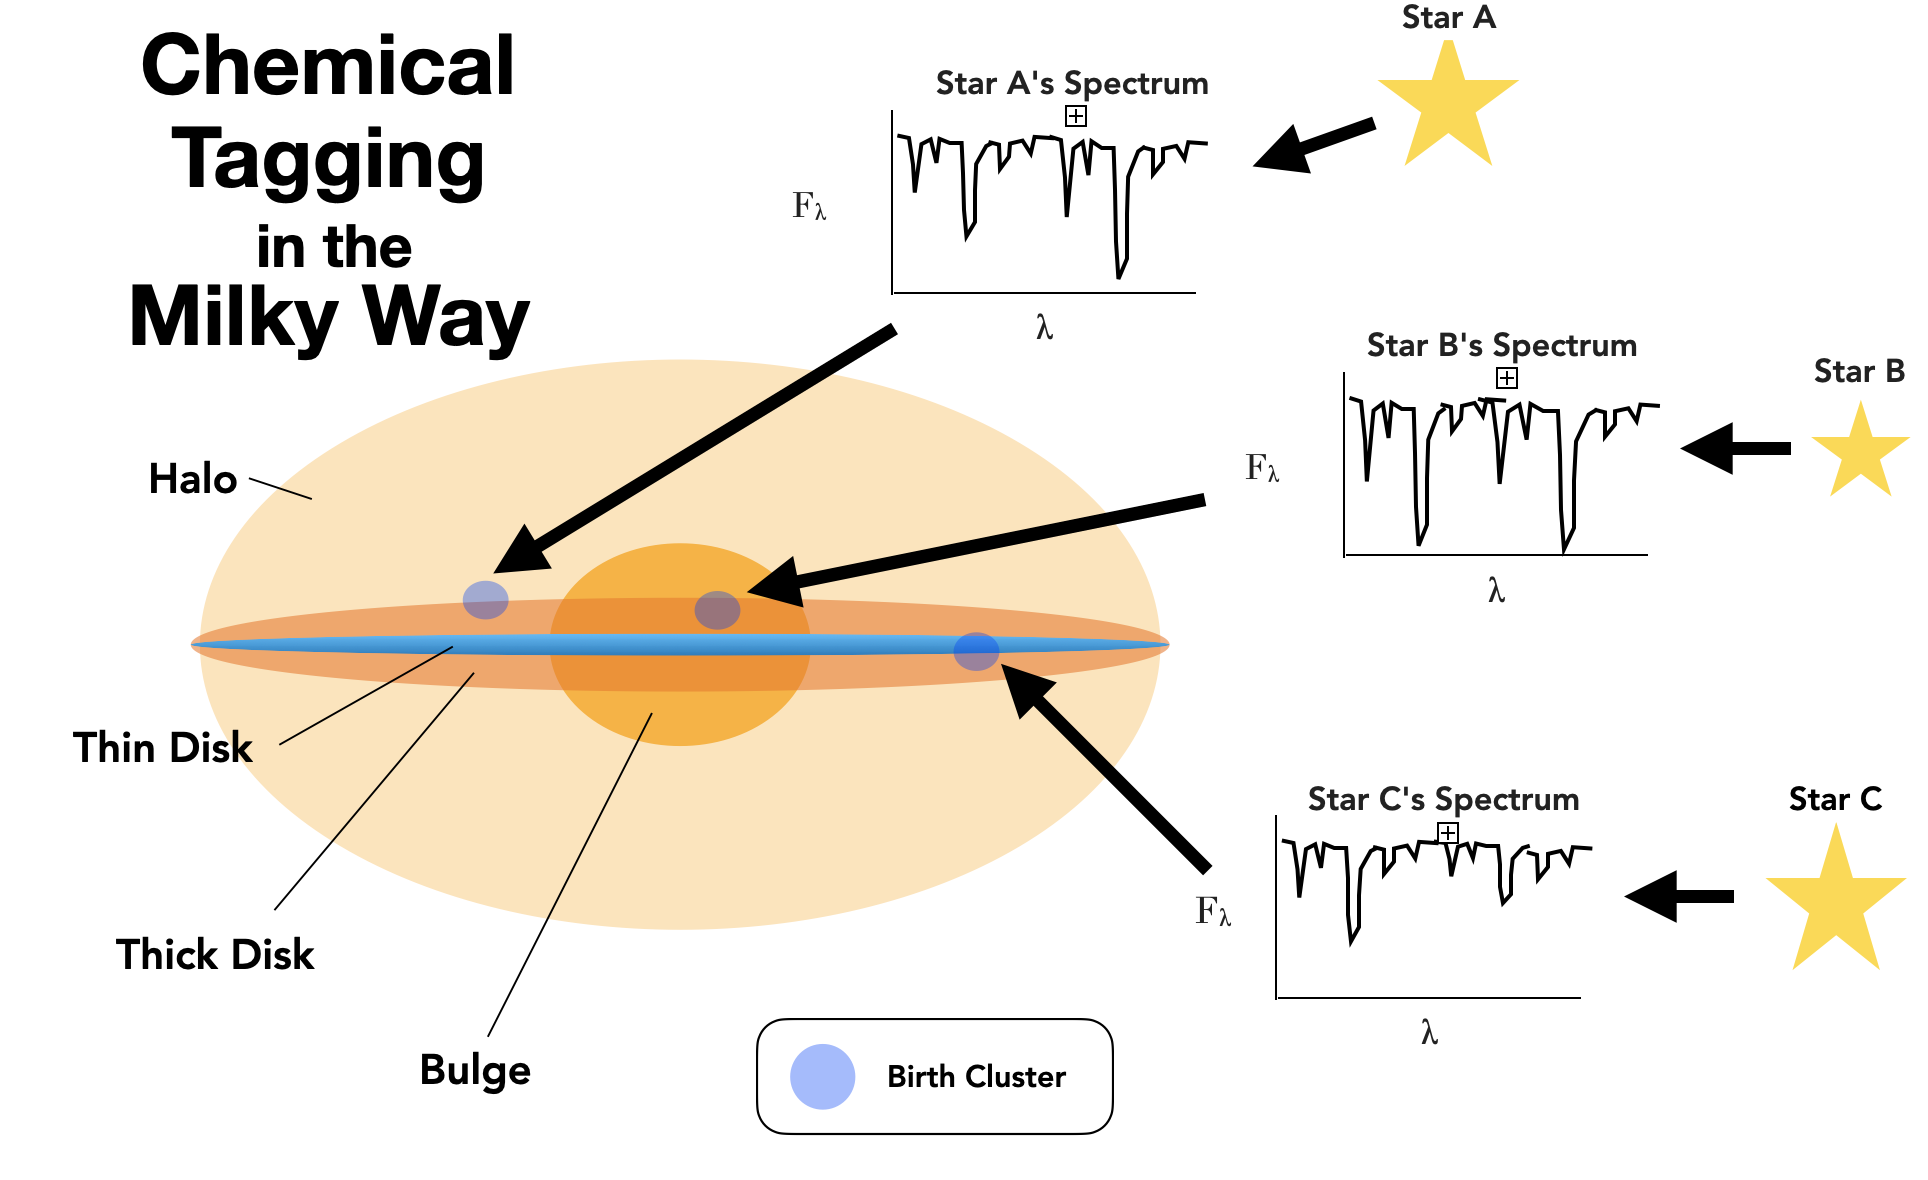
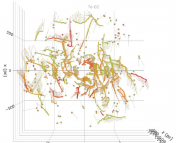
Figure 1: A diagram depicting chemical tagging, the practice of using the chemical compositions of stars, which can be derived from their spectra, to trace their origins. The above diagram depicts the strongest form of chemical tagging, where stars are traced back to their specific birth cloud via their chemical profile. Weaker forms exist as well and involve tagging stars to general, large-scale Milky Way substructure, like the thin disk, thick disk, bulge, and halo.
What’s the idea behind chemical tagging?
Most Milky Way star formation occurs in collapsing molecular clouds, and groups of stars born in the same cloud are called birth clusters. Some birth clusters are massive enough to remain gravitationally bound for several millions to billions of years, and these are the open clusters we observe today throughout the Milky Way disk. However, most stars are born in weakly-bound associations that are quickly dispersed by the Milky Way potential.
The premise behind chemical tagging rests on the notion that the chemical composition of low- and intermediate-mass stars is largely constant throughout their evolution and generally reflects the chemical composition of their birth cloud. This means that, even when stars are dispersed from their birth sites, they retain their chemical composition and carry it with them for much of their life like a fingerprint. The new frontier of chemical tagging seeks to take advantage of this fact by using the chemical fingerprints of dispersed stars to ‘tag’ them back to their birth cluster (see Figure 1).
The ability to tag stars back to their birth cluster relies on two assumptions: 1) that all stars born together possess the same chemical composition, and 2) that birth clusters have unique chemical profiles. Under these two assumptions, if one finds a group of chemically identical stars in the field, they were likely born together in the same molecular cloud. The validity of these two assumptions is still actively being studied, but studies have shown that many open clusters are extremely chemically homogeneous, supporting assumption #1.
We are at a ripe time in astronomy to practice chemical tagging. Thanks to massive spectral surveys like APOGEE, LAMOST, GALAH, RAVE, and Gaia-ESO, we have millions of spectra of Milky Way stars. Therefore, finding chemically similar stars in these data sets, and thus subsequently reconstructing dispersed birth clusters, is of great interest to those seeking to untangle the Galaxy’s evolution.
How do we find out the chemical compositions of stars?
We can estimate the chemical compositions of stars by studying the light they emit. Though some studies have estimated certain chemical parameters, like iron content, from photometry alone, the best way to get precise chemical information for a star is through its spectrum. Stellar spectra can be generalized as black bodies, smooth curves that peak at a wavelength that corresponds with their surface temperatures. If we zoom into a stellar spectrum, however, we can find thousands of bumps and dips caused by specific ions in the atmosphere of the star absorbing and emitting the star’s light. Generally, we can look at the strength of each bump and dip (called a spectral line) to estimate how much of a certain element is contained in the atmosphere of the star.
The amount of a certain element in a star’s atmosphere is called an abundance. Classically, backing out abundances from a stellar spectrum is not a simple task: it requires one to model a stellar atmosphere, generate what the resulting spectrum would look like, and compare it to the observed spectrum in question. Most spectral surveys derive and report chemical abundances for their stellar targets. However, with each reported abundance comes an associated uncertainty, and in many cases, the abundance uncertainties are much larger than the spread in abundances of a group of stars born together. This means that it is difficult to group chemically similar stars when the reported abundances have really large uncertainties.
To get around abundance uncertainties, many people restrict their chemical tagging to solar twins, stars that have identical atmospheric parameters to the Sun. Stellar spectra are affected by not only the precise elements in the atmosphere of a star (which, again, create bumps and dips in the spectrum) but also the surface temperature (Teff), surface gravity (log g), rotation (vsini), and microturbulence (vmic) of the star, among other physical factors. Thus, two chemically identical stars may still have different looking spectra if their atmospheric and physical parameters are different. By restricting chemical tagging to solar twins, however, people can compare apples to apples: any differences between the spectra of solar twins are entirely due to differences in the chemical composition of the stars. This kind of abundance work is called “differential abundance analysis”–it doesn’t require one to derive chemical abundances of each star to get a chemical similarity. One only needs the spectra of the two stars, and any differences in the strengths of each spectral line between both spectra indicate differences in abundance. This method entirely bypasses abundance uncertainties and allows one to achieve incredibly high precisions that are lower than the abundance differences between stars born in the same cluster.
The downside to typical differential abundance analysis is that one can only apply chemical tagging to stars with identical stellar parameters, which restricts the pool of stars dramatically. However, today’s authors find a way to achieve all the benefits of differential abundance analysis but without having to restrict it to solar twins. The authors call this method abundance-free chemical tagging, and it is ideal for chemically tagging large, diverse groups of stars to extremely high precision.
A Neural Network that Disentangles Spectra for High-Precision Chemical Tagging
The way the authors achieve this is by training a neural network (specifically, a conditional autoencoder) to learn the mapping between Teff and log g for a variety of different synthetic spectra with varying chemical abundances. This neural network is composed of two parts: a conditional encoder and a conditional decoder. The conditional encoder takes as input a batch of spectra with associated, preknown Teff and log g values. The conditional encoder then learns the mapping between Teff, log g, and the resulting spectra. It then reduces (disentangles) the input spectra into a lower-dimension vectors representing only chemical composition information, free of the effects of input Teff and log g. The conditional decoder takes the lower-dimension vectors, and the learned mapping scheme from the conditional encoder, to reconstruct (re-tangle) the input spectra. The neural network is fully trained when it is able to a) disentangle input spectra as fully as possible, and b) re-tangle the lower-dimension vectors into the original input spectra with minimal difference. Once the neural network is fully trained, one can feed it observed spectra with preknown Teff and log g and then get out spectra that all share a common (arbitrary) Teff and log g and only vary by their intrinsic differences in chemical abundance.
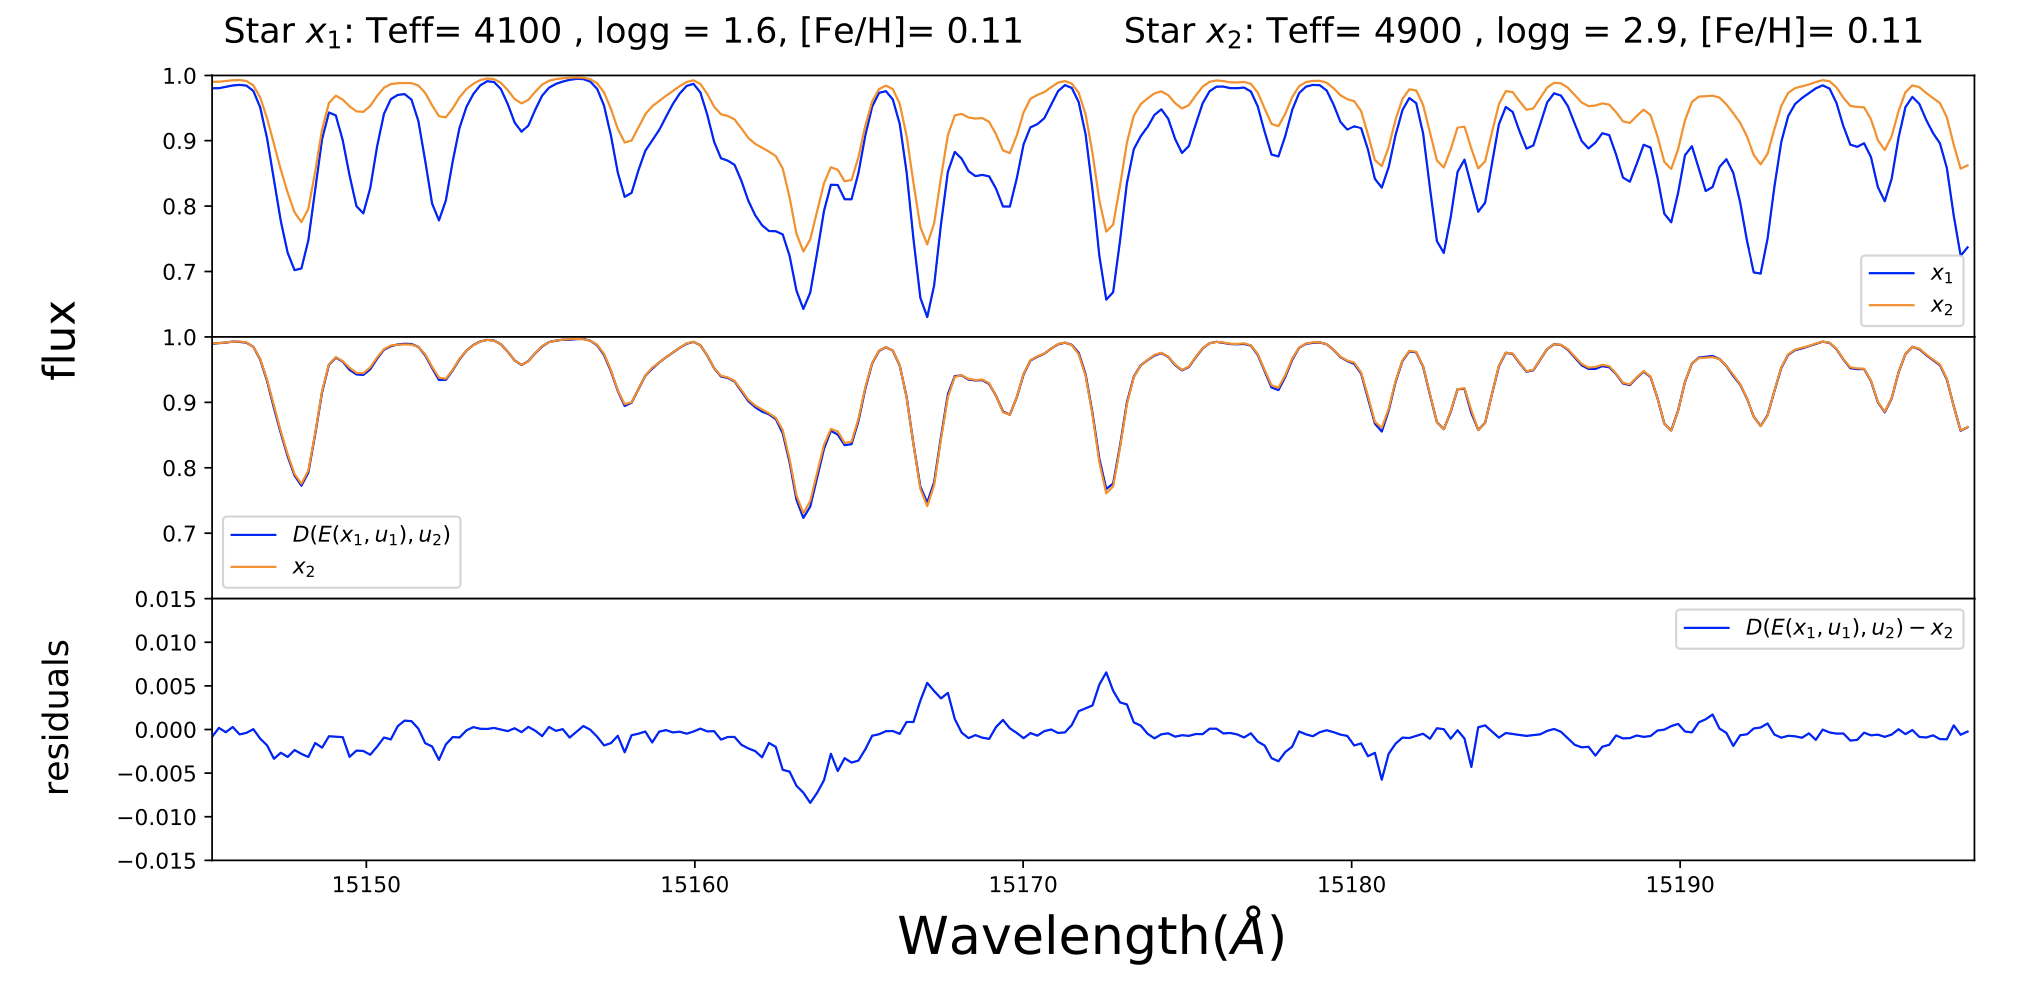
Figure 2: An example of the efficacy of the author’s method of disentangling temperature and surface gravity effects from stellar spectra. The top panel shows the artificial spectra of two stars with identical chemical compositions but differing effective temperatures and log g. Note that even though these two spectra belong to chemically identical stars, they vary dramatically due to effects caused by surface temperature and gravity differences between the stars. The center panel shows the effect of disentangling surface temperature and gravity effects from the spectra using the neural network created by the authors, leaving two spectra that look remarkably similar. The bottom panel shows the residuals of the two spectra, highlighting areas where the two disentangled spectra differ. Figure 5 in the paper.
In short, with this method, the authors are able to disentangle the parameters they don’t care about in a spectrum from the parameters they do care about. In this case, they only want spectra that directly reflect the chemical composition of the star, without the distracting effects of surface temperature, surface gravity, and so on, which alter the shapes of lines significantly. After disentangling the spectra using the neural network, the authors are able to directly compare the spectra of different stars, and any visible differences in the two spectra are purely due to chemical differences in the stars (see Figure 2).
As with differential abundance analysis of solar twins, this method is able to bypass large abundance uncertainties common in classical abundance analysis. However, one is no longer restricted to solar twins: with this method, one can chemically tag the wide array of stars sampled by these massive spectroscopic surveys and use the full data sets to one’s advantage. In addition to allowing us to better probe large spectral surveys for chemically similar stars across a wide range of masses and physical characteristics, this method will also aid in the study of the chemical homogeneity of open clusters, globular clusters, stellar streams, and other cohesive groups of stars whose chemical abundance spread is of interest.
The authors note that their neural network was tested on artificial APOGEE data and was able to successfully retrieve 85% of the chemical pairs infused into their artificial data. The next step is to apply it to real survey data and see whether this method is effective at dealing with the dynamical range and unconstrained physical and systematic effects found in real spectral survey data. The authors finally conclude that their neural network architecture, called FactorDis, may be useful to fields outside of astronomy.
Astrobites edited by Graham Doskoch.
Featured image credit: de Mijolla et al. 2021

