Title: K2-138 g: Spitzer Spots a Sixth Planet for the Citizen Science System
Authors: Kevin K. Hardegree-Ullman, Jessie L. Christiansen, David R. Ciardi, Ian J. M. Crossfield, Courtney D. Dressing, John H. Livingston, Kathryn Volk, Eric Agol, Thomas Barclay, Geert Barentsen, Björn Benneke, Varoujan Gorjian, Martti H. Kristiansen
First Author’s Institution: Caltech / IPAC-NExScI
Status: Accepted for publication in AJ, available on arXiv
What do you get when you have five exoplanets that sing and add a sixth? Why, the K2-138 system of course!
Discovered in 2018 through the Exoplanet Explorers program, K2-138 was the first system found by citizen scientists with K2, the extension mission of the original Kepler program. By spotting regular dips in K2 light curves, the citizen scientists were able to find four sub-Neptune exoplanets, with an additional super-Earth discovered after further analysis. All the planets were found to be in a near perfect 3:2 resonance chain, meaning their orbital periods follow successive ratios of each other – as discussed in this Astrobite.
But, the K2-138 system had more to offer! The analysis which discovered the super-Earth also spotted two additional dips in the K2 light curves, roughly 42 days apart. Dips like these, shown by the dark blue lines, and the letter g, in Figure 1, indicate that a sixth planet might transit K2-138, waiting to be confirmed by the authors of today’s paper.
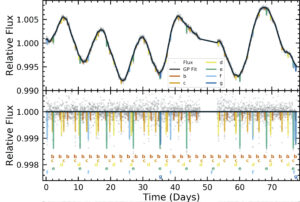
Figure 1: The top panel shows the raw K2 light curve, while the bottom panel shows the same light curve flattened to highlight the planetary transits. In both panels transits of each planet in the system are shown with colored lines. The potential planet g is represented by the darkest blue lines. Adapted from Figure 2 from the paper.
To determine the origins of these mystery dips, the authors used the Spitzer Space Telescope to stare at K2-138 for 11 hours, centered around the predicted transit time of the proposed sixth planet. By fitting the original K2 and new Spitzer data, a clear transit event, shown in Figure 2, was found in the Spitzer observations within an hour of the expected time, confirming the existence of a sixth planet, K2-138g.
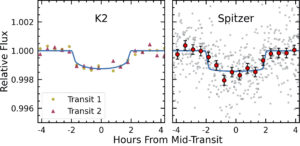
Figure 2: The transit light curves from the K2 and Spitzer observations. In the left panel, yellow circles and red triangles show each of the two transits seen by K2. In the right panel, grey points show the Spitzer observations. The red circles show the data binned to 20 minute intervals, showing the drop in flux caused by the transiting planet. In both panels, the blue line gives the fitted transit model. Adapted from Figure 5 in the paper.
Orbiting at over twice the distance of planet f, the sub-Neptune K2-138g is something of a loner compared to its tightly packed siblings. With its 42 day orbit, K2-138g is not only one of the longest period K2 planets found to date, makes K2-138 the K2 system with the most discovered planets yet.
While the transit durations of the two light curves in Figure 2 are nearly identical, the Spitzer data shows K2-138g to have a slightly larger transit depth, and hence radius. As the two transit lengths are consistent within one sigma, the authors note that the limited number of data points in the K2 transits mean that any outliers could skew the results, causing the slight discrepancy with Spitzer.
The More the Merrier
While planets b, c, d, and e are in near 3:2 resonance with their respective neighbours, the outer planets f and g are not. Given this fact, along with the sizeable gap in orbital period between f and g, could there be additional planets in the system yet to be discovered? It seems possible. If the pattern of resonances continued beyond planet f, resonant orbits would be expected at periods of around 20 and 30 days, but more observations are needed to confirm whether any such planets exist.
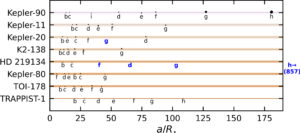
Figure 3: The orbital spacings of a selection of multiplanet systems, in order of the size of their stellar hosts from largest at the top. Each system is shown by a coloured line with a width corresponding to the size of the host star. Transiting planets are represented by circles scaled to the line width, enlarged 10x for clarity. Non-transiting planets are shown in blue. The large separation between the two outer planets of K2-138 is similar to that seen in the Kepler-11, Kepler-20, HD 219134, and Kepler-80 systems. Figure 10 from the paper.
K2-138g isn’t unique in its socially distanced orbit, however. Around half of the 9 other exoplanet systems with 6 or more planets also have a large gap between their outermost planets, as seen in Figure 3. While this apparent trend could be the result of planet formation processes, planets at large orbital radii can be harder to detect, so observational biases might be at play.
A Benchmark System
With its tightly packed resonant inner planets and abundance of sub-Neptunes, the authors argue that the K2-138 system is a more than worthy target of follow-up observations. The inner planets provide an excellent opportunity to study their potential transit-timing variations (TTVs), discrepancies in the regular periods of planets, and observations have already been scheduled. Alongside radial velocity (RV) data, this could enable precise mass measurements and see the potential discovery of additional planets. While the planets have atmospheric signals too small to be studied with the James Webb Space Telescope, they are prime targets for the European Space Agency’s upcoming ARIEL mission. The system’s five sub-Neptunes could provide a key test bed for comparative studies of the atmospheres of a planet category not seen in our solar system.
Whatever the future holds, it certainly seems likely that we’ll be hearing more from K2’s most musical system in the years to come!
Astrobite edited by Brent Shapiro-Albert
Featured image credit: NASA / JPL-Caltech / R. Hurt (IPAC)
Author