Paper Title: The nascent milliquasar VT J154843.06+220812.6: tidal disruption event or extreme accretion-state change?
Authors: Jean Somalwar et al.
First Author’s Institution: Cahill Center for Astronomy and Astrophysics, MC 249-17 California Institute of Technology, Pasadena CA 91125, USA
Status: Accepted to ApJ (open access).
A Boom in The Night
Sparks erupt in the heart of the nearby spiral galaxy SDSS J154843.06+220812.6. Once a quiescent galaxy, a firestorm now rages at its center. Like an awakened furnace devouring fresh coals, the flames intensify. Astronomers know the source to be a radio-emitting nuclear flare of some sort. However, the inferno’s true nature conceals itself beneath the blaze.
Any Colour You Like
The authors of today’s paper meticulously analyze SDSS J154843.06+220812.6 (SDSS J1548 for short; Figure 1) and the variable transient at its center (known as VT J1548) using a slew of instruments, which include: the Very Large Array (radio), NEOWISE survey (infrared), Swift/ X-ray Telescope (X-Ray), XMM-Newton (X-Ray), Keck Observatory (optical), Zwicky Transient Facility (ZTF; optical), Sloan Digital Sky Survey (SDSS; optical), and ATLAS (optical). They use observations from these instruments to study the nuclear source within SDSS J1548 over ~ 3 years (~ 1000 days) in an attempt to expose the secret past of VT J1548.

Figure 1. Optical image of SDSS J1548, the host galaxy of the radio transient VT J1548. The optical nucleus is shown as a small red circle and the radio transient position is shown as a small black circle. The circle radii show the approximate 3σ statistical uncertainties. The blue rectangles show the two slit positions of the Keck Low-Resolution Image Spectrometer and the orange rectangle shows the Keck Echellette Spectrograph and Imager slit position. Figure 1 in the paper.
Clear the Smoke
The fascinating evolution of VT J1548’s magnitude is presented in Figure 2. The authors present NEOWISE infrared observations in two bands, W1 (3.4 µm) and W2 (4.6 µm), over the ~ 3-year flaring event. Then, they compare these observations with optical measurements from the ZTF and ATLAS instruments within the same timespan.
The authors contend that the origin of VT J1548 is most likely: 1) a tidal disruption event (TDE), which occurs when a black hole’s gravitational field shreds a hopeless star apart and violently blows material away, or 2) an active galactic nucleus (AGN) flare, which arises when matter (typically a star) interacts with an accretion disk (a disk of swirling gas, dust, and stars) that surrounds a supermassive black hole (SMBH). Both scenarios are most probable (compared to a supernova, for example) due to the position of VT J1548 at the center of SDSS 1548, where the galaxy’s SMBH resides.
In Figure 2, they show that VT J1548’s infrared magnitude increases (~ 2 -3 times) around March 23, 2018, despite there being no such trend in the optical data! Further, the authors plot two models for the expected range of values for a typical TDE. For such a model, the optical magnitude of a TDE is expected to flare and decay on the order of 10s of days. While there is no optical magnitude relation to compare with for this source, the infrared data shows a steady increase over the full ~ 3-year window. These results suggest that: 1) VT J1548 may be optically obscured by a gaseous disk that still emits in the infrared, and 2) VT J1548 does not behave like a standard TDE. Both results further muddy the waters. Most AGN flares do in fact feature extreme optical variability during a brightening event, which supports the likelihood of an underlying TDE, rather than an AGN flare. However, it is extremely atypical for a TDE to last ~ 3 years (most last 10s of days), which strengthens the case that VT J1548 is more likely an AGN flare.

Figure 2. The optical (ZTF and ATLAS; red and light orange data points) and infrared (NEOWISE W1 and W2 bands; blue and dark orange data points) light curves for SDSS J1548. The triangle markers denote the 5σ upper limits. The infrared light curve flares by ~2 − 3 magnitudes beginning around MJD 58100 (~ March 23, 2018). There is no obvious optical flare. The shaded regions correspond to the range of fluxes expected in different bands (as denoted by the color of the band) from typical optical TDEs. The start date of each band is adjusted but is still consistent with the start of the infrared flare. Figure 3 in the paper.
Follow The Evidence
Considering the competing evidence, the authors seek to strengthen their analysis by incorporating additional measurements of SDSS J1548. In particular, they use emission line fluxes from the optical SDSS spectrum of the galaxy (Figure 3 in paper) to construct Baldwin, Phillips, and Terlevich diagrams. These diagrams incorporate prominent emission line ratios to distinguish gas ionization sources as either star-forming, Seyfert (AGN), or a composite of multiple ionization sources. They serve as the traditional AGN selection tool for most spectroscopic surveys. The SDSS J1548 BPT diagrams (Figure 2 in the paper) reveal that there is weak or no AGN activity in the host galaxy. Additionally, they find that their VLA (radio) and Swift (X-ray Telescope) (X-ray) observations are inconsistent with their AGN accretion models (Figure 10 in paper). These findings flip the coin and strengthen the likelihood that VT J1548 is exclusively a TDE.
However, using the same SDSS data, they measure broad emission (FWHM > 1000 km s-1) from the Hα line (FWHM ~ 1900 km s-1). Broad emission lines are typically strong identifiers of AGN activity since they trace the high-velocity gas clouds closest to the black hole. Consequently, this finding flips the coin once again, favoring the AGN-origin of VT-J1548.
They also confirm emission from highly ionized species of gas called coronal lines (e.g., [Fe X] λ6375, [Fe XI] λ7894, and [S XII] λ7612). The origin of these lines is contested, but many researchers consider them to be produced by a transient, high-energy, photoionizing continuum (e.g., an AGN). They are also associated with AGN outflows and may orbit near the SMBH of an AGN.
Moreover, the authors measure the bolometric luminosity of the flare, which is a measure of a source’s energy across the entire electromagnetic spectrum. They determine a value of 1044 erg s-1, which is very close to the Eddington Luminosity (LEdd) of the SMBH (i.e., the luminosity of the SMBH when its gravitational pull is balanced by outward radiation pressure). Beyond LEdd, gas will be blown away by radiation.
These results are all consistent with AGN activity.
What’s even more compelling? The transient emission lines commonly associated with optically detected TDEs (He II λ4686 and N III λ4640; see Bowen fluorescence) are NOT detected.
Is your head also spinning by now?
Figure 3 might help ease the tension. In the figure, the authors present a cartoon model that depicts the most likely environment of VT J1548. They suspect that an accretion disk is indeed most likely (despite their model results) and that outflows produced by the nuclear flare collide with a clumpy torus, which optically masks the flare, but still glows in the infrared. Nonetheless, they still withhold their final consensus and posit that VT J1548 may still arise from a TDE or an AGN flare.
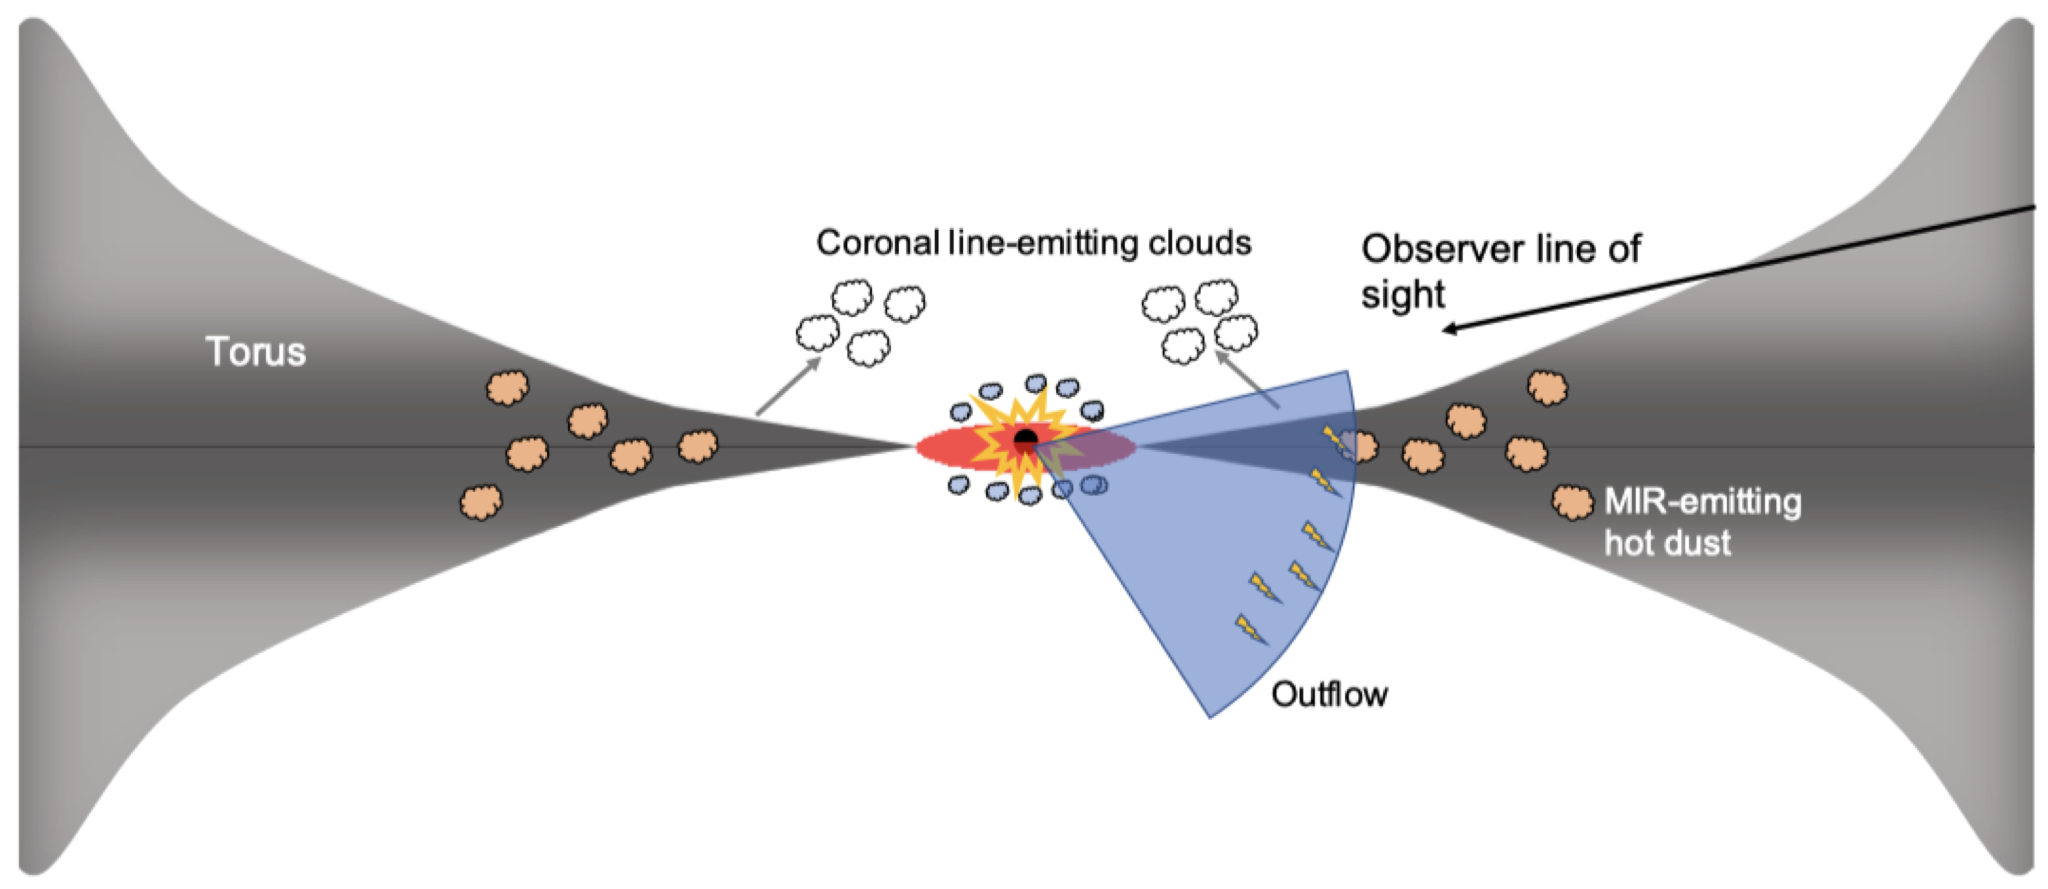
Figure 3: A cartoon representation of SDSS J1548/VT J1548. Some event triggered a flare at the nucleus of the galaxy, which caused the formation of an accretion disk or was associated with enhanced accretion from a pre-existing accretion disk. The broad Hα emission originates from near the accretion disk (∼1000 AU) and is extincted by the dusty torus along the line of sight to the observer. Any optical emission from the transient event is also heavily extincted. The coronal line clouds may be orbiting the SMBH or within a radiatively driven wind. infrared emission comes from the heated dust in the torus. The radio-emitting outflow is shown in blue. Figure 11 in the paper.
Walking Backwards?
So, are we any closer to determining the nature of VT J1548? According to the authors… maybe? There is tantalizing evidence for both TDE and AGN regimes. On the one hand, VT J1548 shows no optical fluctuations, which is not typical for most AGNs. X-ray and radio observations also do not strongly support an accretion disk, a vital attribute of all AGN. On the other hand, the nuclear flare has experienced an increase in its infrared magnitude for ~ 3 years, well beyond the typical “flare” intensity of a standard optical TDE (10s of days). Further, the emission lines associated with classical TDEs (e.g., He II λ4686 and N III λ4640) are not present in the SDSS spectrum; whereas, there is broad Hα emission. The galaxy also has a relatively high bolometric luminosity. Collectively, these are telltale signs of AGN activity.
Maybe the two culprits co-produced VT J1548? What if a TDE is triggering the activation of an AGN? To truly determine this, additional multi-wavelength observations are required for prolonged durations.
Today’s paper is a reminder of the expansive distance we have yet to traverse in our quest to understand the universe.
Image Credit: NRAO/AUI/NSF/NASA
Editor: Graham Doskoch