
This bite was written by Prachi Khatri. Prachi Khatri is a Ph.D. student at the Argelander Insitute for Astronomy in Bonn, Germany, working on galaxy evolution. She uses cosmological hydrodynamical simulations to study molecular gas, carbon chemistry, and star formation in high-redshift galaxies. Apart from astronomy, she enjoys writing poems, reading fiction, cooking, and soaking in the Sun.
Author: A. F. Ramos Padilla1, L. Wang, S. Ploeckinger, F. F. S. van der Tak and S. C. Trager
First Author’s Institution: Kapteyn Astronomical Institute, University of Groningen, and SRON Netherlands Institute for Space Research, Groningen, the Netherlands
Status: Published in A&A (open access on arXiv)
The interstellar medium (ISM) is the material filling up the space between the stars in a galaxy and is mainly composed of hydrogen, helium, a trace amount of metals, and dust. The ISM can be classified into different phases depending on the physical conditions, each with a characteristic density, temperature, ionisation fraction, and chemical composition. Owing to these differences, the phases show variations in their emission properties. The phases are broadly classified into atomic, molecular, or ionised based on the dominant state of the most abundant element – hydrogen in that phase. As the names suggest, that state is atomic hydrogen (HI), molecular hydrogen (H2), and ionised hydrogen (H+ or HII) for the three phases, respectively.
Among the numerous emission lines that originate in the ISM, the [CII] line at 158 µm is one of the brightest in star-forming galaxies and arises from the 2P3/2–2P1/2 finestructure transition in the ground state of singly ionised carbon, C+. Look here for the fine structure of hydrogen. It is an essential cooling line in the ISM and is often used as a tracer of the star formation activity in nearby galaxies. However, the efficacy of this line as a tracer of the physical conditions in the ISM is plagued by the fact that it originates from several phases of the ISM – atomic, molecular, and ionised. To work around this problem, the authors of today’s paper have developed a framework to model the [CII] emission from the three different phases and study their relative contributions as a function of galaxy properties, like metallicity and star formation rate (SFR).
Painting the (simulation) walls, a.k.a., post-processing
Cosmological simulations of galaxies often do not resolve the ISM very well – the simulation treats a blob of gas of mass Mres (∼ 104 − 106 M⊙) as a single particle. Then, it solves for the motion and evolution of this particle without accounting for the density structure and chemical composition within the blob. After running the simulation up to the desired time (or redshift), the missing details are“painted” onto the blobs based on physically motivated analytical prescriptions, empirical relations from observations, or scaling relations from numerical simulations of smaller scales. This procedure is called “post-processing” a simulation.
In this paper, the authors predict the [CII] luminosity of simulated galaxies in post- processing. Their method is summarized in Figure 1. For every simulated galaxy, each gas particle is first split into neutral and ionised components based on ionisation equilibrium. Ionisation equilibrium means that the number of ionisations and recombinations balance each other locally. Then, the strength of the interstellar radiation field (ISRF) from both nearby and distant stars is computed at the location of each gas particle. Next, the mass in the neutral component is distributed into several spherical clouds, each of which has an onion-like structure (as shown in Figure 1). The chemical composition of the cloud layers varies with the depth into the cloud and is computed based on the density and metallicity of the neutral gas and the ISRF.
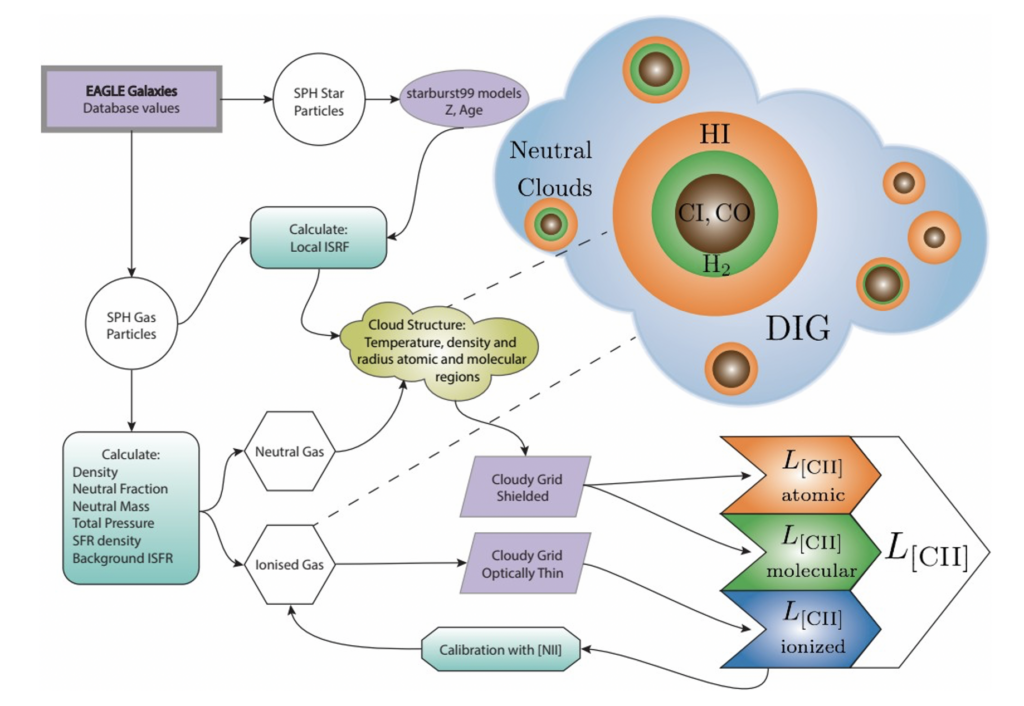
This way, one obtains the fractions of the neutral atomic, molecular, and diffuse ionised components for each gas particle in the galaxy. The [CII] emission from each of these components is computed using Cloudy (a spectral synthesis code that predicts the emission from the ISM for a broad range of physical conditions). Summing up the contributions from the three phases for all gas particles gives the total [CII] luminosity L[CII] of the galaxy.
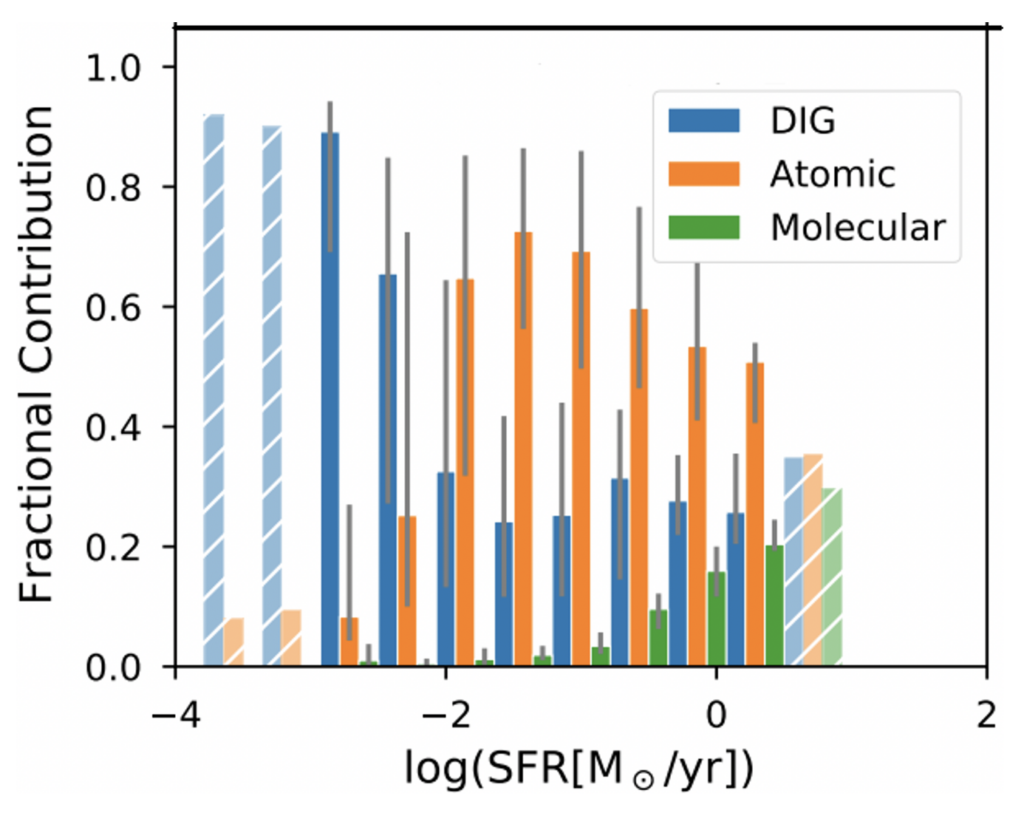
As an application of their model, the authors predict the [CII] luminosities of present-day galaxies (i.e., at redshift z ∼ 0) in the EAGLE suite of cosmological hydrodynamical simulations and study the share of each phase to L[CII]. Here is a video of one of the EAGLE simulations. They find that the relative contributions depend on the galaxy-averaged SFR (see Figure 2). As the SFR increases, the contribution from the neutral phases (atomic + molecular) increases (especially from the molecular phase) while that from the diffuse ionised gas (DIG) phase decreases.
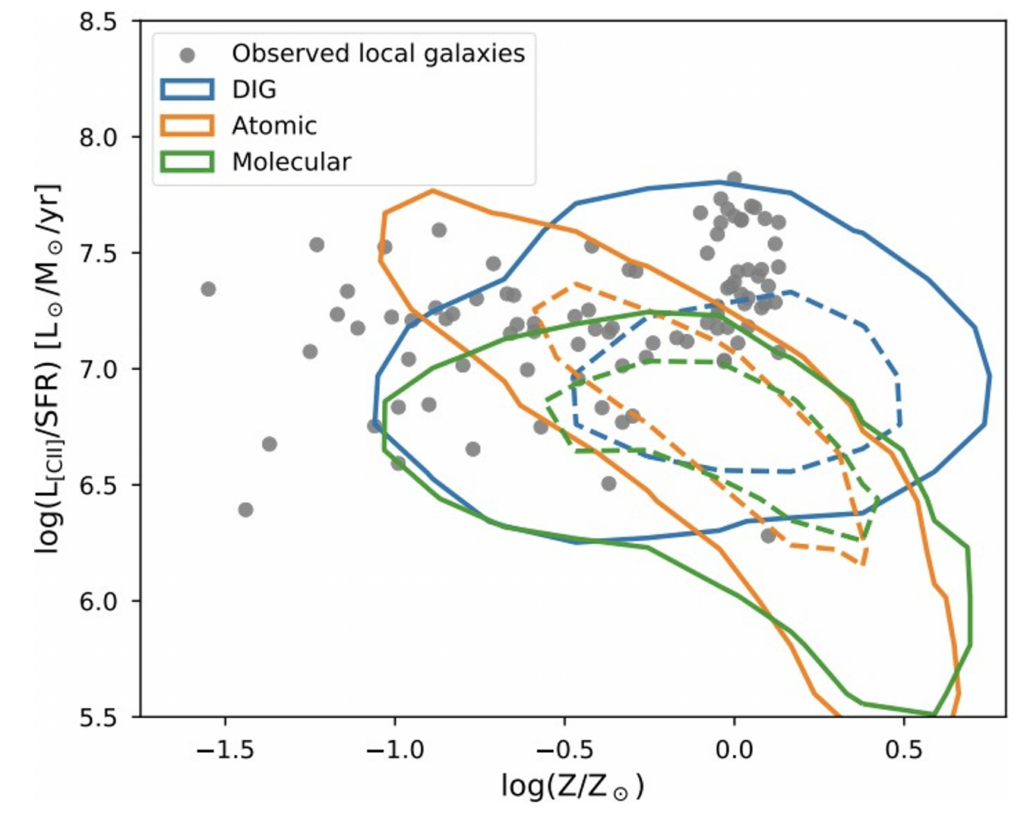
They further look at how the L[CII]/SFR ratio of each phase varies as a function of the average gas-phase metallicity of the galaxy, Z. As seen in Figure 3, this ratio is nearly constant (albeit with a large scatter) for DIG while it increases with decreasing metallicity for the other two phases, though it develops a plateau for the molecular phase at Z ∼ 0.3Z⊙.
Through their analysis, the authors show that their framework helps traverse the parameter space of galaxy properties and delineate how the origin of the [CII] line varies with these properties. Extending such studies to high-redshift galaxies can provide invaluable insights into the origin of [CII] in those systems. These can also guide efforts on the observational front for effectively using the [CII] looking “glass” to infer the physical conditions in the ISM of faraway galaxies.
Astrobite edited by Abby Waggoner
Featured image credit: SOFIA