Title: Interpreting the atmospheric composition of exoplanets: sensitivity to planet formation assumptions
Authors: Paul Mollière, Tamara Molyarova, Bertram Bitsch, Thomas Henning, Aaron Schneider, Laura Kreidberg, Christian Eistrup, Remo Burn, Evert Nasedkin, Dmitry Semenov, Christoph Mordasini, Martin Schlecker, Kamber R. Schwarz, Sylvestre Lacour, Mathias Nowak, Matthäus Schulik
First Author’s Institution: Max-Planck-Institut für Astronomie, Königstuhl 17, 69117 Heidelberg, Germany
Status: Accepted to ApJ [open access]
One of the biggest questions that drive astronomers is “Where did we come from?” Whether studying the earliest hours of the universe, or the formation of stars and galaxies, or the compositions of planets orbiting distant stars (exoplanets), astronomers try to use observations of the universe to piece together a story that describes how things got to be the way they are. For the better part of two decades, exoplanet focused astronomers have attempted to measure the molecules that make up the atmospheres of exoplanets in order to better understand how those exoplanets formed. Understanding how many different exoplanets form can then help astronomers understand how our own solar system formed, and how Earth, and life itself, came to be.
There are a few problems that are preventing astronomers from making those connections reliably, however. Well, a lot of problems, actually. For one, exoplanet atmospheres are hard to measure, but that might change soon with the launch of JWST. For another, planet formation is dynamic, and different planet formation models can produce dramatically different looking atmospheres. Today’s paper presents a new framework for tackling this second problem, and shows how different planet formation models can lead to different interpretations about how the exoplanet HR 8799e formed.
Making planets is complex!
Planet formation is a dense topic (interesting recent astrobites include this one, and this one, and an old review bite), but in the broadest strokes: Planets form from disks of gas and dust that surround young stars, called “protoplanetary disks.” Giant planets, like Jupiter, form when their rocky cores grow massive enough (by smashing into other rocks) to vacuum up gas from the protoplanetary disk.
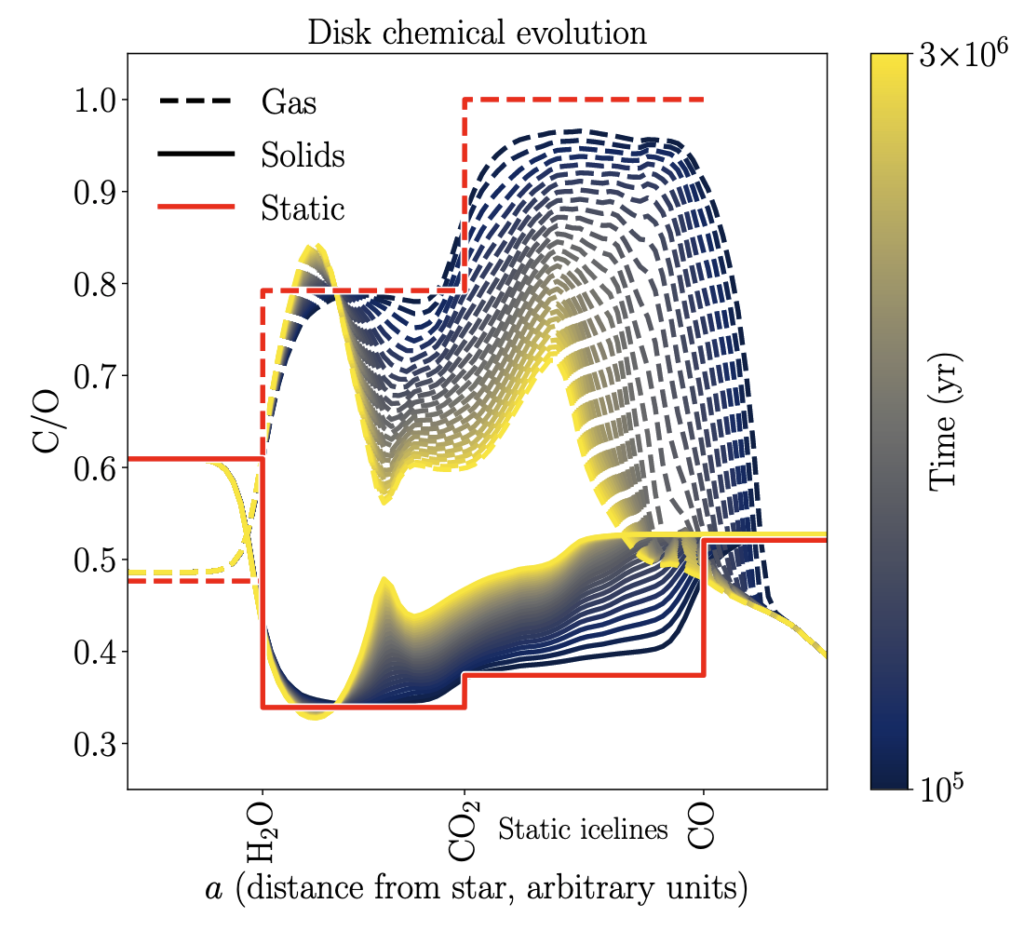
When and where a forming planet vacuums up its gas will have implications for which molecules end up in its atmosphere. This is because, as you go out further from the central star in a disk, the disk gets colder, and molecules that were gaseous can condense down into ices and become solid. These are “ice lines” within the protoplanetary disk (see the red line in Figure 1). About ten years ago, a study suggested that the ratio of carbon atoms to oxygen atoms in an exoplanet’s atmosphere could indicate which ice lines it formed between, since the freezing out of water, carbon dioxide, and carbon monoxide changes the ratio of those two elements in the gas of the disk. This study suggested that if the C/O ratio of an exoplanet could be measured, astronomers could tell where in the protoplanetary disk it formed.
As discussed in today’s paper, things aren’t so simple. One example the paper uses is the fact that, just as the exoplanet is forming, the disk chemistry is changing over time, as the disk is heated by the newly born star, and is disrupted by the newly born planet. Figure 1 shows the C/O ratio throughout the disk for both the static model introduced in the previous study, and snapshots in time of a disk evolving as, for instance, carbon monoxide is turned into carbon dioxide by heat from the star.
Flipping the table (or, “formation model inversion”)
This quest isn’t hopeless: today’s paper sought to present a framework where the different assumptions and uncertainties mentioned above could be compared with available atmospheric measurements, in order to describe meaningful connections between observations and model predictions.
The real problem is that these complex models of planet formation require a set of assumptions as input, and give the predicted atmospheric measurement of a planet as output. Astronomers measure the output, so the models have to be “inverted” in order to determine the formation location of the planet. What today’s paper’s new framework does is generate many different models with various input parameters, and compare their outputs to the measured abundances of a given exoplanet, to see which model inputs result in the closest match to the measurements. They can do this for different models, and then compare the best matching input parameters between models. This allows them to examine what different models predict for the origin of a given exoplanet.
Where’d HR 8799e get its carbon and oxygen?
HR 8799e is the innermost gas giant planet in a system of four directly imaged giant planets. Today’s paper uses their new framework on HR 8799e and demonstrates how including the change in time of the chemicals in the protoplanetary disk, and the movement of small rocks through the disk during planet formation change the predicted formation history of the planet.
HR 8799e’s atmosphere was previously studied using data from the VLTI/GRAVITY instrument. That study found the planet’s C/O ratio to be 0.6 (that is, 6 carbon atoms for every 10 oxygen atoms). They use this measurement and their new analysis framework to compare the simplistic model of a protoplanetary disk and a chemically evolving disk.
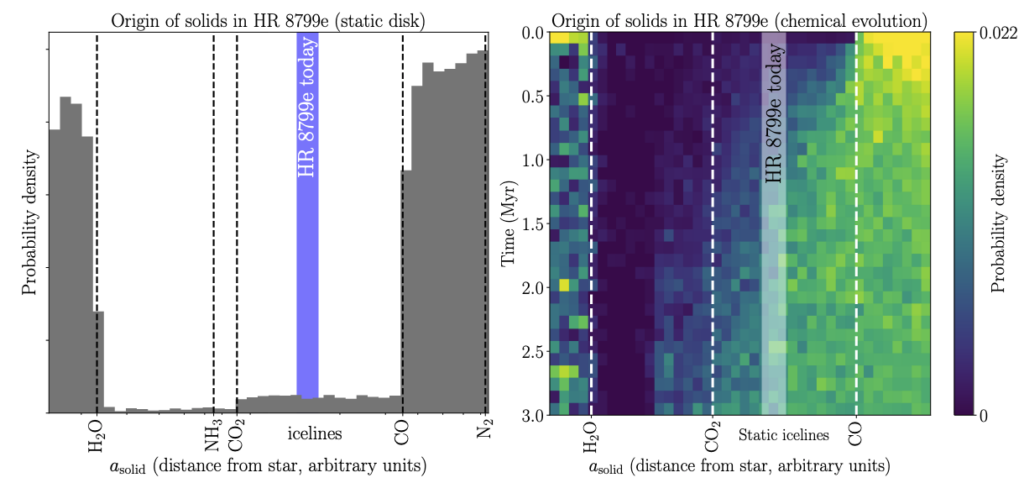
Their results indicate that the simple model predicts that HR 8799e formed either within the H20 ice line (very close to its host star), or outside the CO ice line (far away). Either way, the planet now orbits in the middle of these two extremes, indicating that it must have migrated from where it originally formed (see Figure 2, left panel). However, the chemically evolving disk model makes a slightly different prediction, indicating that as the disk chemically evolves, the most likely formation location of HR 8799e moves inwards from beyond the CO ice line to within it (see Figure 2, right panel). This could indicate that, depending on when HR 8799e began forming relative to the disk’s chemical evolution, it might not have needed to migrate to get to its current position.
Today’s astrobite presents a complex narrative of exoplanetary archaeology, exploring different assumptions that can change how astronomers infer the formation history of exoplanets. With new and improved atmospheric detections on the horizon (hello JWST!) this new framework for comparing formation models will prove a useful tool to help astronomers puzzle out how and where exoplanets form, and maybe eventually, how we got here.
Astrobite edited by Lynnie Saade
Featured image credit: “GRAVITY instrument breaks new ground in exoplanet imaging HR 8799e” illustration by ESO/L. Calçada/SpaceEngine, edited by William Balmer