Title: Impact of COVID-19 on Astronomy: Two Years In
Authors: Vanessa Böhm and Jia Liu
First Author’s Institution: Berkeley Center for Cosmological Physics, University of California, 341 Campbell Hall, Berkeley, CA 94720, USA
Status: published on arXiv
If you regularly check the arXiv, you have probably noticed the increasing number of astronomy papers each year. Even during the COVID pandemic that started in 2019, this trend does not seem to slow down. The global COVID pandemic has disrupted many people’s lives, but perhaps astronomers are lucky enough to stay productive. Is this feeling supported by statistics? In this paper, the authors study paper productivity in astronomy and examine the COVID impact by gender and by country.
Methods
This study analyzed NASA ADS astronomy records from 1950 to 2022. From all the paper entries in this time period, unique authors are identified by matching given and family names. Unfortunately, names and authors don’t correspond in a unique one-to-one fashion, so the authors match names to the best of their ability and only use the list of identified unique authors for further analysis.
The gender of each unique author is determined using the given name. Individual author names are classified by genderize.io and are kept if the gender probability exceeds 80%. The country of each author is determined from the most recent affiliation. Only countries with more than a thousand authors are kept in the analysis to ensure low Poisson noise.
Results
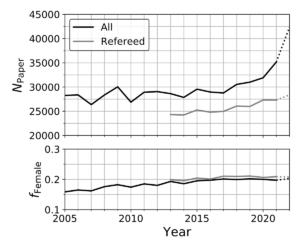
Both the total number of papers and the number of refereed papers per year has been increasing since 2014. This has continued throughout the COVID pandemic, which can be seen in the top panel of Fig. 1. Among these papers, the fraction that were written by female first authors has stayed around 20%. As we will show later, the increase in the number of papers is mostly driven by individual authors writing more papers, while the number of new authors decreased.
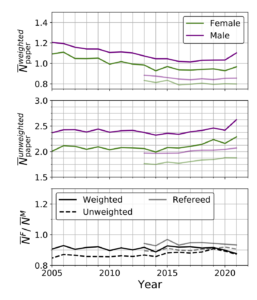
Split by gender: The changes in individual productivity are interesting and we can split it up further. Fig 2 shows the average productivity of male and female authors. The productivity is broken up into refereed and all papers, and into unweighted total count and a weighted count. The “weighted paper count” is based on the ranked author list, where the first author receives full weight, the second author receives half the weight, and so on. In Fig 2, we see an overall increase in both weighted and unweighted counts. An initial drop is visible at the onset of COVID in all categories except in the weighted count of male authors. Despite the overall increase, the ratio between female- and male-authored papers decreased during COVID. This means that female authors did not experience as much productivity boost as male authors did.
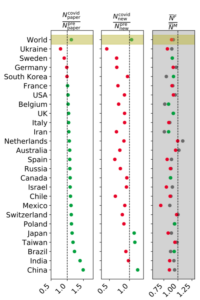
Split by country: COVID impacts also vary strongly by country. For example, due to strict control measures, China has not seen a large number of COVID cases in the first two years of the pandemic. Thus we need to look at the change in each country before and after COVID. The left panel in Fig 3 shows the number of papers per year during COVID as a fraction of the number of papers before, which is a breakdown of the overall increase seen in Fig. 1. The middle panel shows the number of new authors during COVID as a fraction of before. Regions like Japan, Taiwan, and China drove up the total number of new researchers, but the other 22 countries in the sample see a decreasing number of authors during COVID. Most countries see the number of new authors decrease to 50%-70% of the pre-covid level. This indicates that COVID increased the barrier to enter astronomy as a new researcher in most of the world. Combined with the overall increase in paper output, this implies that the individual productivity of existing researchers went up.
Even though individual productivity improved, it has declined for women in comparison to men in 17 out of 25 countries. In all countries, female researchers were not as productive as men during COVID. This is seen even in the Netherlands, Australia, and Switzerland, where female astronomers used to outperform men. Before covid, 20% of papers had female first authors. During covid, this fraction decreased in 14 out of 25 countries.
Afterword
The global COVID pandemic has upended many lives and disrupted academic work on various levels. At my university, other departments suffered from their labs shutting down and fieldwork getting canceled, which presumably led to fewer publications. Students switched to online classes and changed their degree plans to work around ever-changing COVID restrictions. With conferences canceled and childcare suspended, it seems surprising that astronomers managed to publish more papers than ever in this difficult time. Looking at paper counts can only be the beginning to grasp the impact of COVID on our research community, as we are analyzing the end result without probing the cause. To get at the full picture, we must pay attention to individual experiences in addition to aggregated statistics. For all of us who lived through this, cherish your stories and share them; for everyone who wants to understand, listen with an open heart.
Astrobite edited by Jessica Hislop
Featured image credit: Zili Shen